Data
153,089 items of data are available, covering 153,089 participants.
Some values have special meanings defined by Data-Coding
45.
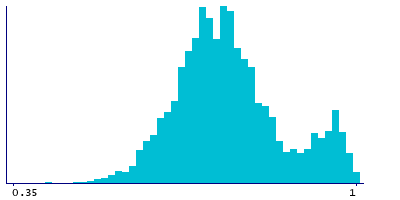
| Maximum | 1 |
| Decile 9 | 0.93 |
| Decile 8 | 0.83 |
| Decile 7 | 0.79 |
| Decile 6 | 0.77 |
| Median | 0.75 |
| Decile 4 | 0.72 |
| Decile 3 | 0.7 |
| Decile 2 | 0.68 |
| Decile 1 | 0.64 |
| Minimum | 0.42 |
|
|
- Mean = 0.758639
- Std.dev = 0.101466
- 251 items have value 0 (indicates no data on the Social Development Index for that geographical location)
|
Notes
An area-based measure of social development - the Social Development Index (ie, the Indice de Desarollo Social, 2010
1) was obtained for each participant based on their block of residence (determined from Global Positioning System coordinates recorded at the baseline household visit). The Social Development Index is a composite score calculated from block or manzana-level (each including just one or a small group of houses or buildings) measures of six domains: quality and space of housing (33.8% weighting), access to health and social security (29.1%), education (24.4%), ownership of household goods (6.0%), adequate access to water supply and drainage (3.8%), and energy (2.9%).
Note that zero values for this variable correspond to no data for the Social Development Index.
1. Evalua Ciudad de Mexico. Indice de Desarrollo Social de la Ciudad de Mexico por manzana. Gobierno de la Ciudad de Mexico. 2020. https://evalua.cdmx.gob.mx/principales-atribuciones/medicion-del-indice-de-desarrollo-social-de-las-unidades-territoriales/medicion-del-indice-de-desarrollo-social-de-las-unidades-territoriales (accessed Nov 1, 2022).
Coding 45 defines 1 special value:
- 0 represents "indicates no data on the Social Development Index for that geographical location"
