Data
40,297 items of data are available, covering 40,297 participants.
Some values have special meanings defined by Data-Coding
41.
Units of measurement are %.
| Maximum | 76.54 |
| Decile 9 | 61 |
| Decile 8 | 60.24 |
| Decile 7 | 59.74 |
| Decile 6 | 59.34 |
| Median | 58.97 |
| Decile 4 | 58.58 |
| Decile 3 | 58.16 |
| Decile 2 | 57.64 |
| Decile 1 | 56.88 |
| Minimum | 21.9 |
|
|
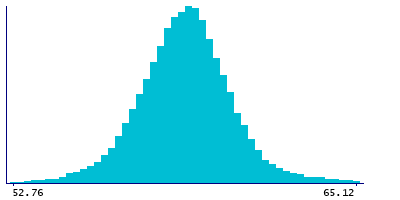
- Mean = 58.9707
- Std.dev = 1.86504
- 113 items below graph minimum of 52.76
- 246 items above graph maximum of 65.12
- 52 items have value -3 (indicates value was rejected by automatic sample and measurement quality control)
- 271 items have value -1 (indicates a measurement not defined (i.e. derived value or ratio cannot be given due to low concentration in original measure))
|

