Data
40,297 items of data are available, covering 40,297 participants.
Some values have special meanings defined by Data-Coding
41.
Units of measurement are %.
| Maximum | 69.28 |
| Decile 9 | 57.19 |
| Decile 8 | 56.04 |
| Decile 7 | 55.27 |
| Decile 6 | 54.59 |
| Median | 53.96 |
| Decile 4 | 53.36 |
| Decile 3 | 52.68 |
| Decile 2 | 51.87 |
| Decile 1 | 50.67 |
| Minimum | 28.1 |
|
|
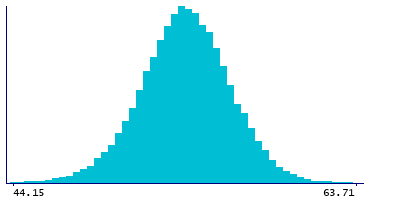
- Mean = 53.9276
- Std.dev = 2.63518
- 70 items below graph minimum of 44.15
- 28 items above graph maximum of 63.71
- 51 items have value -3 (indicates value was rejected by automatic sample and measurement quality control)
- 7 items have value -1 (indicates a measurement not defined (i.e. derived value or ratio cannot be given due to low concentration in original measure))
|

