Data
40,297 items of data are available, covering 40,297 participants.
Some values have special meanings defined by Data-Coding
41.
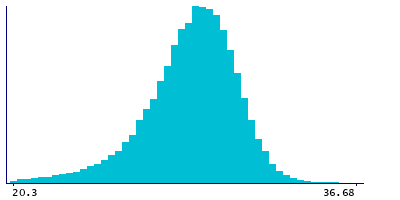
Units of measurement are %.
| Maximum | 38.8 |
| Decile 9 | 31.22 |
| Decile 8 | 30.5 |
| Decile 7 | 29.96 |
| Decile 6 | 29.47 |
| Median | 28.98 |
| Decile 4 | 28.45 |
| Decile 3 | 27.87 |
| Decile 2 | 27.09 |
| Decile 1 | 25.76 |
| Minimum | 5.371 |
|
|
- Mean = 28.6333
- Std.dev = 2.48119
- 416 items below graph minimum of 20.3
- 4 items above graph maximum of 36.68
- 53 items have value -3 (indicates value was rejected by automatic sample and measurement quality control)
- 30 items have value -1 (indicates a measurement not defined (i.e. derived value or ratio cannot be given due to low concentration in original measure))
|
Notes
Phospholipids to total lipids ratio in very small VLDL (XS-VLDL-PL_%) (%)
Coding 41 defines 5 special values:
- -5 represents "indicates derived value or ratio cannot be computed (missing code I)"
- -4 represents "indicates value not available (missing code A)"
- -3 represents "indicates value was rejected by automatic sample and measurement quality control"
- -2 represents "indicates a measurement cannot be quantified due to detected irregularity in sample - see tags"
- -1 represents "indicates a measurement not defined (i.e. derived value or ratio cannot be given due to low concentration in original measure)"

