Data
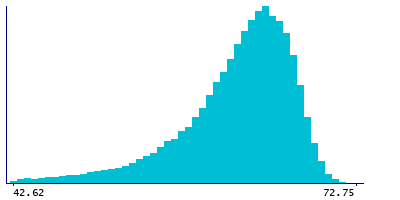
40,297 items of data are available, covering 40,297 participants.
Some values have special meanings defined by Data-Coding
41.
Units of measurement are %.
| Maximum | 72.75 |
| Decile 9 | 67.34 |
| Decile 8 | 66.19 |
| Decile 7 | 65.17 |
| Decile 6 | 64.22 |
| Median | 63.2 |
| Decile 4 | 62.05 |
| Decile 3 | 60.61 |
| Decile 2 | 58.6 |
| Decile 1 | 54.98 |
| Minimum | 26.9 |
|
|
- Mean = 61.8868
- Std.dev = 5.68499
- 556 items below graph minimum of 42.62
- 78 items have value -3 (indicates value was rejected by automatic sample and measurement quality control)
- 271 items have value -1 (indicates a measurement not defined (i.e. derived value or ratio cannot be given due to low concentration in original measure))
|
Notes
Total cholesterol to total lipids ratio in medium LDL (M-LDL-C_%) (%)
Coding 41 defines 5 special values:
- -5 represents "indicates derived value or ratio cannot be computed (missing code I)"
- -4 represents "indicates value not available (missing code A)"
- -3 represents "indicates value was rejected by automatic sample and measurement quality control"
- -2 represents "indicates a measurement cannot be quantified due to detected irregularity in sample - see tags"
- -1 represents "indicates a measurement not defined (i.e. derived value or ratio cannot be given due to low concentration in original measure)"

