Data
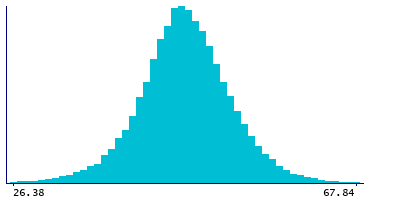
40,297 items of data are available, covering 40,297 participants.
Some values have special meanings defined by Data-Coding
41.
Units of measurement are %.
| Maximum | 86.14 |
| Decile 9 | 54.02 |
| Decile 8 | 51.45 |
| Decile 7 | 49.72 |
| Decile 6 | 48.3 |
| Median | 47.03 |
| Decile 4 | 45.81 |
| Decile 3 | 44.47 |
| Decile 2 | 42.83 |
| Decile 1 | 40.2 |
| Minimum | 1.38 |
|
|
- Mean = 47.0249
- Std.dev = 5.85975
- 161 items below graph minimum of 26.38
- 50 items above graph maximum of 67.84
- 57 items have value -3 (indicates value was rejected by automatic sample and measurement quality control)
- 143 items have value -1 (indicates a measurement not defined (i.e. derived value or ratio cannot be given due to low concentration in original measure))
|
Notes
Total cholesterol to total lipids ratio in very large HDL (XL-HDL-C_%) (%)
Coding 41 defines 5 special values:
- -5 represents "indicates derived value or ratio cannot be computed (missing code I)"
- -4 represents "indicates value not available (missing code A)"
- -3 represents "indicates value was rejected by automatic sample and measurement quality control"
- -2 represents "indicates a measurement cannot be quantified due to detected irregularity in sample - see tags"
- -1 represents "indicates a measurement not defined (i.e. derived value or ratio cannot be given due to low concentration in original measure)"

