Data
40,297 items of data are available, covering 40,297 participants.
Some values have special meanings defined by Data-Coding
41.
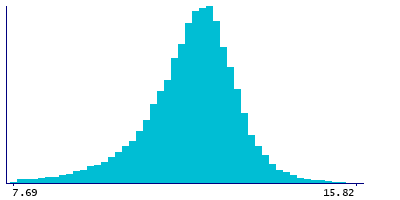
Units of measurement are %.
| Maximum | 26 |
| Decile 9 | 13.11 |
| Decile 8 | 12.73 |
| Decile 7 | 12.46 |
| Decile 6 | 12.24 |
| Median | 12 |
| Decile 4 | 11.78 |
| Decile 3 | 11.48 |
| Decile 2 | 11.09 |
| Decile 1 | 10.4 |
| Minimum | 0.26 |
|
|
- Mean = 11.845
- Std.dev = 1.25643
- 434 items below graph minimum of 7.69
- 30 items above graph maximum of 15.82
- 57 items have value -3 (indicates value was rejected by automatic sample and measurement quality control)
- 143 items have value -1 (indicates a measurement not defined (i.e. derived value or ratio cannot be given due to low concentration in original measure))
|
Notes
Free cholesterol to total lipids ratio in very large HDL (XL-HDL-FC_%) (%)
Coding 41 defines 5 special values:
- -5 represents "indicates derived value or ratio cannot be computed (missing code I)"
- -4 represents "indicates value not available (missing code A)"
- -3 represents "indicates value was rejected by automatic sample and measurement quality control"
- -2 represents "indicates a measurement cannot be quantified due to detected irregularity in sample - see tags"
- -1 represents "indicates a measurement not defined (i.e. derived value or ratio cannot be given due to low concentration in original measure)"

