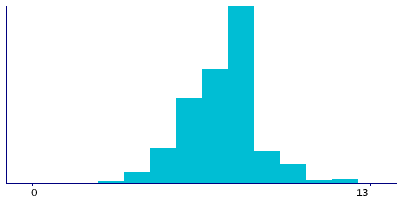
Data
169,418 items of data are available, covering 159,384 participants.
Defined-instances run from 0 to 1, labelled using Instancing
1.
Units of measurement are hours.
| Maximum | 22 |
| Decile 9 | 9 |
| Decile 8 | 8 |
| Decile 7 | 8 |
| Decile 6 | 8 |
| Median | 7 |
| Decile 4 | 7 |
| Decile 3 | 7 |
| Decile 2 | 6 |
| Decile 1 | 5 |
| Minimum | 1 |
|
|
- There are 22 distinct values.
- Mean = 7.28827
- Std.dev = 1.45504
- 285 items above graph maximum of 13
|
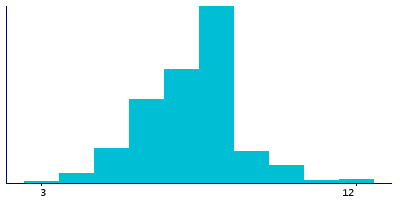
2 Instances
Instance 0 : Baseline (1998-2004)
159,373 participants, 159,373 items
| Maximum | 22 |
| Decile 9 | 9 |
| Decile 8 | 8 |
| Decile 7 | 8 |
| Decile 6 | 8 |
| Median | 7 |
| Decile 4 | 7 |
| Decile 3 | 7 |
| Decile 2 | 6 |
| Decile 1 | 6 |
| Minimum | 1 |
|
|
- There are 22 distinct values.
- Mean = 7.28297
- Std.dev = 1.4317
- 69 items below graph minimum of 3
- 331 items above graph maximum of 12
|
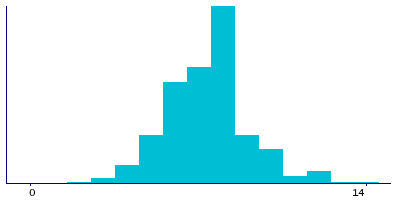
Instance 1 : Resurvey (2015-2019)
10,045 participants, 10,045 items
| Maximum | 20 |
| Decile 9 | 9.5 |
| Decile 8 | 8 |
| Decile 7 | 8 |
| Decile 6 | 8 |
| Median | 7 |
| Decile 4 | 7 |
| Decile 3 | 6 |
| Decile 2 | 6 |
| Decile 1 | 5 |
| Minimum | 1 |
|
|
- There are 18 distinct values.
- Mean = 7.37232
- Std.dev = 1.78288
- 25 items above graph maximum of 14
|
Notes
Number of hours slept daily
0 Related Data-Fields
There are no related data-fields
0 Resources
There are no matching Resources
