Data
1,420 items of data are available, covering 1,420 participants.
Defined-instances run from 26 to 26, labelled using Instancing
1.
Units of measurement are Not applicable.
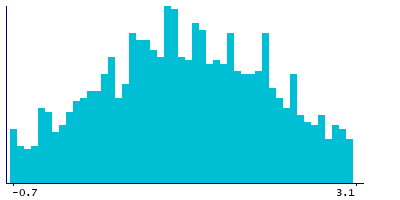
| Maximum | 3.1 |
| Decile 9 | 2.5 |
| Decile 8 | 2.1 |
| Decile 7 | 1.8 |
| Decile 6 | 1.5 |
| Median | 1.2 |
| Decile 4 | 0.9 |
| Decile 3 | 0.7 |
| Decile 2 | 0.4 |
| Decile 1 | -0.1 |
| Minimum | -0.7 |
|
|
- Mean = 1.20817
- Std.dev = 0.92394
- 12 items above graph maximum of 3.1
|
Notes
dxattlr09 - T score Trunk/Limb Fat Mass Ratio - DXA at 60-64 years
0 Related Data-Fields
There are no related data-fields
0 Resources
There are no matching Resources