Data
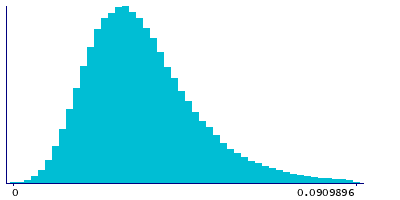
162,490 items of data are available, covering 153,106 participants.
Some values have special meanings defined by Data-Coding
41.
Defined-instances run from 0 to 1, labelled using Instancing
1.
Units of measurement are mmol/l.
| Maximum | 0.328913 |
| Decile 9 | 0.0543468 |
| Decile 8 | 0.0454435 |
| Decile 7 | 0.0399251 |
| Decile 6 | 0.0357978 |
| Median | 0.032224 |
| Decile 4 | 0.0289336 |
| Decile 3 | 0.0256209 |
| Decile 2 | 0.0220864 |
| Decile 1 | 0.017704 |
| Minimum | 7.81719e-07 |
|

|
- Mean = 0.0346748
- Std.dev = 0.015619
- 1027 items above graph maximum of 0.0909896
- 1569 items have value -3 (indicates value was rejected by automatic sample and measurement quality control)
|
2 Instances
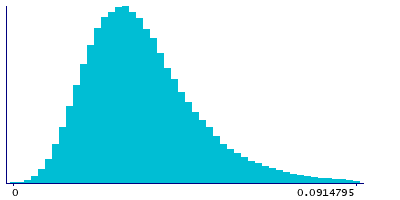
Instance 0 : Baseline (1998-2004)
152,833 participants, 151,570 items
| Maximum | 0.328913 |
| Decile 9 | 0.0545327 |
| Decile 8 | 0.0455918 |
| Decile 7 | 0.040009 |
| Decile 6 | 0.0358553 |
| Median | 0.0322531 |
| Decile 4 | 0.0289354 |
| Decile 3 | 0.0255889 |
| Decile 2 | 0.0220278 |
| Decile 1 | 0.0175859 |
| Minimum | 7.81719e-07 |
|

|
- Mean = 0.0347156
- Std.dev = 0.0157339
- 952 items above graph maximum of 0.0914795
- 1263 items have value -3 (indicates value was rejected by automatic sample and measurement quality control)
|
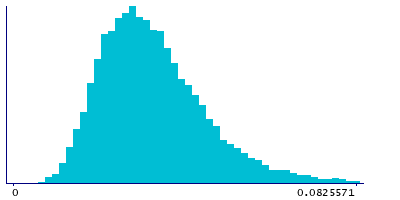
Instance 1 : Resurvey (2015-2019)
9,657 participants, 9,351 items
| Maximum | 0.199223 |
| Decile 9 | 0.0509684 |
| Decile 8 | 0.0434754 |
| Decile 7 | 0.0386194 |
| Decile 6 | 0.0350229 |
| Median | 0.0318993 |
| Decile 4 | 0.028918 |
| Decile 3 | 0.0260727 |
| Decile 2 | 0.0229791 |
| Decile 1 | 0.0193797 |
| Minimum | 0.0028751 |
|

|
- Mean = 0.0340143
- Std.dev = 0.0136062
- 67 items above graph maximum of 0.0825571
- 306 items have value -3 (indicates value was rejected by automatic sample and measurement quality control)
|
Notes
Triglycerides in large HDL (L-HDL-TG) (mmol/l)
Coding 41 defines 5 special values:
- -5 represents "indicates derived value or ratio cannot be computed (missing code I)"
- -4 represents "indicates value not available (missing code A)"
- -3 represents "indicates value was rejected by automatic sample and measurement quality control"
- -2 represents "indicates a measurement cannot be quantified due to detected irregularity in sample - see tags"
- -1 represents "indicates a measurement not defined (i.e. derived value or ratio cannot be given due to low concentration in original measure)"
0 Related Data-Fields
There are no related data-fields
0 Resources
There are no matching Resources


