Data
162,490 items of data are available, covering 153,106 participants.
Some values have special meanings defined by Data-Coding
41.
Defined-instances run from 0 to 1, labelled using Instancing
1.
Units of measurement are %.
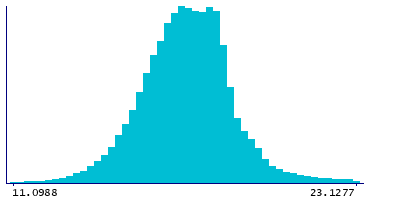
| Maximum | 44.7378 |
| Decile 9 | 19.1181 |
| Decile 8 | 18.3834 |
| Decile 7 | 17.9898 |
| Decile 6 | 17.5898 |
| Median | 17.1914 |
| Decile 4 | 16.8024 |
| Decile 3 | 16.3854 |
| Decile 2 | 15.8758 |
| Decile 1 | 15.1084 |
| Minimum | 0.00106122 |
|
|
- Mean = 17.1429
- Std.dev = 2.42076
- 1906 items below graph minimum of 11.0988
- 2200 items above graph maximum of 23.1277
- 2915 items have value -3 (indicates value was rejected by automatic sample and measurement quality control)
|
2 Instances
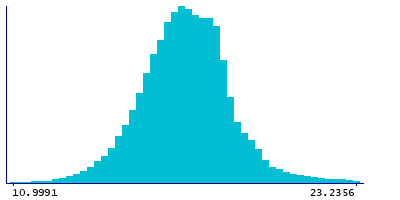
Instance 0 : Baseline (1998-2004)
152,833 participants, 150,247 items
| Maximum | 44.7378 |
| Decile 9 | 19.1568 |
| Decile 8 | 18.3747 |
| Decile 7 | 17.9547 |
| Decile 6 | 17.543 |
| Median | 17.1474 |
| Decile 4 | 16.7619 |
| Decile 3 | 16.3472 |
| Decile 2 | 15.8434 |
| Decile 1 | 15.0779 |
| Minimum | 0.00106122 |
|
|
- Mean = 17.1213
- Std.dev = 2.44751
- 1793 items below graph minimum of 10.9991
- 2085 items above graph maximum of 23.2356
- 2586 items have value -3 (indicates value was rejected by automatic sample and measurement quality control)
|
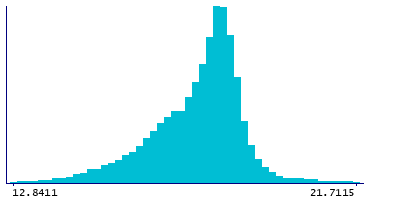
Instance 1 : Resurvey (2015-2019)
9,657 participants, 9,328 items
| Maximum | 42.6858 |
| Decile 9 | 18.7547 |
| Decile 8 | 18.4548 |
| Decile 7 | 18.2488 |
| Decile 6 | 18.0596 |
| Median | 17.8402 |
| Decile 4 | 17.5359 |
| Decile 3 | 17.1221 |
| Decile 2 | 16.6129 |
| Decile 1 | 15.7979 |
| Minimum | 0.125913 |
|
|
- Mean = 17.4901
- Std.dev = 1.9066
- 141 items below graph minimum of 12.8411
- 68 items above graph maximum of 21.7115
- 329 items have value -3 (indicates value was rejected by automatic sample and measurement quality control)
|
Notes
Phospholipids to total lipids ratio in chylomicrons and extremely large VLDL (XXL-VLDL-PL %) (%)
Coding 41 defines 5 special values:
- -5 represents "indicates derived value or ratio cannot be computed (missing code I)"
- -4 represents "indicates value not available (missing code A)"
- -3 represents "indicates value was rejected by automatic sample and measurement quality control"
- -2 represents "indicates a measurement cannot be quantified due to detected irregularity in sample - see tags"
- -1 represents "indicates a measurement not defined (i.e. derived value or ratio cannot be given due to low concentration in original measure)"
0 Related Data-Fields
There are no related data-fields
0 Resources
There are no matching Resources
