Data
162,490 items of data are available, covering 153,106 participants.
Some values have special meanings defined by Data-Coding
41.
Defined-instances run from 0 to 1, labelled using Instancing
1.
Units of measurement are %.
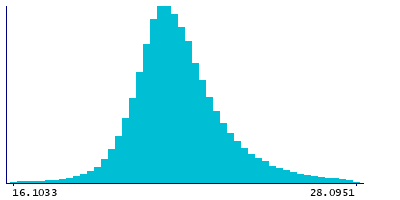
| Maximum | 99.9999 |
| Decile 9 | 24.0979 |
| Decile 8 | 23.0639 |
| Decile 7 | 22.4821 |
| Decile 6 | 22.0642 |
| Median | 21.7075 |
| Decile 4 | 21.3826 |
| Decile 3 | 21.0575 |
| Decile 2 | 20.6793 |
| Decile 1 | 20.1006 |
| Minimum | 0.000777909 |
|
|
- Mean = 21.943
- Std.dev = 2.03272
- 775 items below graph minimum of 16.1033
- 1799 items above graph maximum of 28.0951
- 1577 items have value -3 (indicates value was rejected by automatic sample and measurement quality control)
|
2 Instances
Instance 0 : Baseline (1998-2004)
152,833 participants, 151,562 items
| Maximum | 99.9999 |
| Decile 9 | 24.0956 |
| Decile 8 | 23.0647 |
| Decile 7 | 22.4833 |
| Decile 6 | 22.0663 |
| Median | 21.7099 |
| Decile 4 | 21.3847 |
| Decile 3 | 21.0575 |
| Decile 2 | 20.679 |
| Decile 1 | 20.0977 |
| Minimum | 0.000777909 |
|

|
- Mean = 21.943
- Std.dev = 2.03403
- 733 items below graph minimum of 16.0997
- 1699 items above graph maximum of 28.0936
- 1271 items have value -3 (indicates value was rejected by automatic sample and measurement quality control)
|
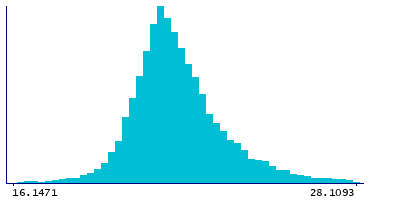
Instance 1 : Resurvey (2015-2019)
9,657 participants, 9,351 items
| Maximum | 42.5498 |
| Decile 9 | 24.1219 |
| Decile 8 | 23.0547 |
| Decile 7 | 22.4562 |
| Decile 6 | 22.0262 |
| Median | 21.6657 |
| Decile 4 | 21.3501 |
| Decile 3 | 21.0569 |
| Decile 2 | 20.6864 |
| Decile 1 | 20.1345 |
| Minimum | 0.471267 |
|
|
- Mean = 21.9435
- Std.dev = 2.01134
- 41 items below graph minimum of 16.1471
- 100 items above graph maximum of 28.1093
- 306 items have value -3 (indicates value was rejected by automatic sample and measurement quality control)
|
Notes
Phospholipids to total lipids ratio in large VLDL (L-VLDL-PL %) (%)
Coding 41 defines 5 special values:
- -5 represents "indicates derived value or ratio cannot be computed (missing code I)"
- -4 represents "indicates value not available (missing code A)"
- -3 represents "indicates value was rejected by automatic sample and measurement quality control"
- -2 represents "indicates a measurement cannot be quantified due to detected irregularity in sample - see tags"
- -1 represents "indicates a measurement not defined (i.e. derived value or ratio cannot be given due to low concentration in original measure)"
0 Related Data-Fields
There are no related data-fields
0 Resources
There are no matching Resources
