Data
162,490 items of data are available, covering 153,106 participants.
Some values have special meanings defined by Data-Coding
41.
Defined-instances run from 0 to 1, labelled using Instancing
1.
Units of measurement are %.
| Maximum | 31.8414 |
| Decile 9 | 25.1181 |
| Decile 8 | 24.3041 |
| Decile 7 | 23.7475 |
| Decile 6 | 23.2863 |
| Median | 22.8454 |
| Decile 4 | 22.401 |
| Decile 3 | 21.9062 |
| Decile 2 | 21.2959 |
| Decile 1 | 20.3269 |
| Minimum | 0.000253708 |
|
|
- Mean = 22.7626
- Std.dev = 1.97162
- 346 items below graph minimum of 15.5357
- 32 items above graph maximum of 29.9093
- 1569 items have value -3 (indicates value was rejected by automatic sample and measurement quality control)
|
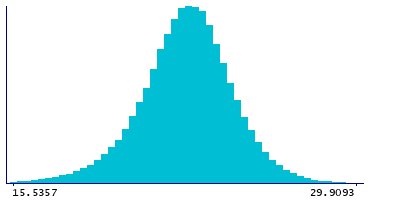
2 Instances
Instance 0 : Baseline (1998-2004)
152,833 participants, 151,570 items
| Maximum | 31.8414 |
| Decile 9 | 25.1369 |
| Decile 8 | 24.3144 |
| Decile 7 | 23.7515 |
| Decile 6 | 23.285 |
| Median | 22.8398 |
| Decile 4 | 22.3898 |
| Decile 3 | 21.8916 |
| Decile 2 | 21.2762 |
| Decile 1 | 20.2994 |
| Minimum | 0.000253708 |
|

|
- Mean = 22.7572
- Std.dev = 1.98874
- 320 items below graph minimum of 15.4619
- 29 items above graph maximum of 29.9744
- 1263 items have value -3 (indicates value was rejected by automatic sample and measurement quality control)
|
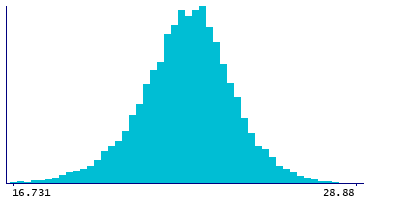
Instance 1 : Resurvey (2015-2019)
9,657 participants, 9,351 items
| Maximum | 29.6084 |
| Decile 9 | 24.8303 |
| Decile 8 | 24.1527 |
| Decile 7 | 23.689 |
| Decile 6 | 23.3085 |
| Median | 22.9173 |
| Decile 4 | 22.5448 |
| Decile 3 | 22.1282 |
| Decile 2 | 21.5822 |
| Decile 1 | 20.7807 |
| Minimum | 7.9635 |
|
|
- Mean = 22.8497
- Std.dev = 1.6674
- 22 items below graph minimum of 16.731
- 4 items above graph maximum of 28.88
- 306 items have value -3 (indicates value was rejected by automatic sample and measurement quality control)
|
Notes
Phospholipids to total lipids ratio in small VLDL (S-VLDL-PL %) (%)
Coding 41 defines 5 special values:
- -5 represents "indicates derived value or ratio cannot be computed (missing code I)"
- -4 represents "indicates value not available (missing code A)"
- -3 represents "indicates value was rejected by automatic sample and measurement quality control"
- -2 represents "indicates a measurement cannot be quantified due to detected irregularity in sample - see tags"
- -1 represents "indicates a measurement not defined (i.e. derived value or ratio cannot be given due to low concentration in original measure)"
0 Related Data-Fields
There are no related data-fields
0 Resources
There are no matching Resources
