Data
162,490 items of data are available, covering 153,106 participants.
Some values have special meanings defined by Data-Coding
41.
Defined-instances run from 0 to 1, labelled using Instancing
1.
Units of measurement are %.
| Maximum | 82.7647 |
| Decile 9 | 50.2267 |
| Decile 8 | 49.4999 |
| Decile 7 | 49.0116 |
| Decile 6 | 48.6037 |
| Median | 48.2219 |
| Decile 4 | 47.8474 |
| Decile 3 | 47.4552 |
| Decile 2 | 47.0069 |
| Decile 1 | 46.41 |
| Minimum | 9.73362e-05 |
|
|
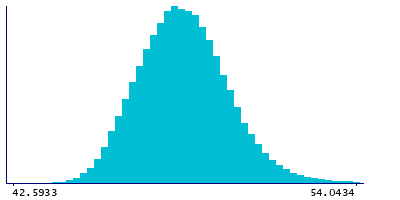
- Mean = 48.3417
- Std.dev = 1.95169
- 63 items below graph minimum of 42.5933
- 1014 items above graph maximum of 54.0434
- 1569 items have value -3 (indicates value was rejected by automatic sample and measurement quality control)
|
2 Instances
Instance 0 : Baseline (1998-2004)
152,833 participants, 151,570 items
| Maximum | 82.7647 |
| Decile 9 | 50.2456 |
| Decile 8 | 49.5107 |
| Decile 7 | 49.0163 |
| Decile 6 | 48.6013 |
| Median | 48.2133 |
| Decile 4 | 47.8329 |
| Decile 3 | 47.4341 |
| Decile 2 | 46.98 |
| Decile 1 | 46.3825 |
| Minimum | 9.73362e-05 |
|

|
- Mean = 48.3363
- Std.dev = 1.97115
- 61 items below graph minimum of 42.5194
- 967 items above graph maximum of 54.1087
- 1263 items have value -3 (indicates value was rejected by automatic sample and measurement quality control)
|
Instance 1 : Resurvey (2015-2019)
9,657 participants, 9,351 items
| Maximum | 79.9013 |
| Decile 9 | 49.9404 |
| Decile 8 | 49.3556 |
| Decile 7 | 48.9529 |
| Decile 6 | 48.6356 |
| Median | 48.3303 |
| Decile 4 | 48.0318 |
| Decile 3 | 47.7302 |
| Decile 2 | 47.3789 |
| Decile 1 | 46.8873 |
| Minimum | 26.2151 |
|

|
- Mean = 48.4294
- Std.dev = 1.60113
- 2 items below graph minimum of 43.8341
- 50 items above graph maximum of 52.9936
- 306 items have value -3 (indicates value was rejected by automatic sample and measurement quality control)
|
Notes
Phospholipids to total lipids ratio in medium HDL (M-HDL-PL %) (%)
Coding 41 defines 5 special values:
- -5 represents "indicates derived value or ratio cannot be computed (missing code I)"
- -4 represents "indicates value not available (missing code A)"
- -3 represents "indicates value was rejected by automatic sample and measurement quality control"
- -2 represents "indicates a measurement cannot be quantified due to detected irregularity in sample - see tags"
- -1 represents "indicates a measurement not defined (i.e. derived value or ratio cannot be given due to low concentration in original measure)"
0 Related Data-Fields
There are no related data-fields
0 Resources
There are no matching Resources
