Data
162,490 items of data are available, covering 153,106 participants.
Some values have special meanings defined by Data-Coding
41.
Defined-instances run from 0 to 1, labelled using Instancing
1.
Units of measurement are %.
| Maximum | 46.8134 |
| Decile 9 | 40.3209 |
| Decile 8 | 39.4107 |
| Decile 7 | 38.7191 |
| Decile 6 | 38.1112 |
| Median | 37.5174 |
| Decile 4 | 36.8957 |
| Decile 3 | 36.1868 |
| Decile 2 | 35.296 |
| Decile 1 | 33.8758 |
| Minimum | 0 |
|
|
- Mean = 37.1813
- Std.dev = 3.05655
- 1128 items below graph minimum of 27.4308
- 1 item above graph maximum of 46.766
- 1569 items have value -3 (indicates value was rejected by automatic sample and measurement quality control)
|
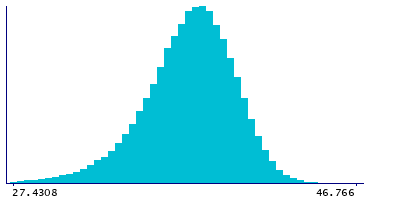
2 Instances
Instance 0 : Baseline (1998-2004)
152,833 participants, 151,570 items
| Maximum | 46.8134 |
| Decile 9 | 40.3536 |
| Decile 8 | 39.439 |
| Decile 7 | 38.7385 |
| Decile 6 | 38.1235 |
| Median | 37.5232 |
| Decile 4 | 36.8922 |
| Decile 3 | 36.1738 |
| Decile 2 | 35.2758 |
| Decile 1 | 33.843 |
| Minimum | 0 |
|

|
- Mean = 37.1822
- Std.dev = 3.07975
- 1075 items below graph minimum of 27.3324
- 1263 items have value -3 (indicates value was rejected by automatic sample and measurement quality control)
|
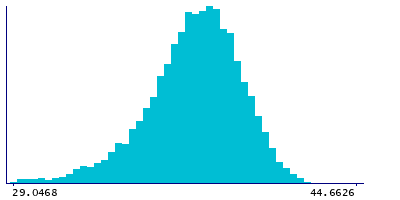
Instance 1 : Resurvey (2015-2019)
9,657 participants, 9,351 items
| Maximum | 44.6626 |
| Decile 9 | 39.7978 |
| Decile 8 | 39.0033 |
| Decile 7 | 38.4447 |
| Decile 6 | 37.9586 |
| Median | 37.4487 |
| Decile 4 | 36.9403 |
| Decile 3 | 36.3663 |
| Decile 2 | 35.6221 |
| Decile 1 | 34.4223 |
| Minimum | 0 |
|
|
- Mean = 37.1662
- Std.dev = 2.65236
- 53 items below graph minimum of 29.0468
- 306 items have value -3 (indicates value was rejected by automatic sample and measurement quality control)
|
Notes
Cholesterol to total lipids ratio in small HDL (S-HDL-C %) (%)
Coding 41 defines 5 special values:
- -5 represents "indicates derived value or ratio cannot be computed (missing code I)"
- -4 represents "indicates value not available (missing code A)"
- -3 represents "indicates value was rejected by automatic sample and measurement quality control"
- -2 represents "indicates a measurement cannot be quantified due to detected irregularity in sample - see tags"
- -1 represents "indicates a measurement not defined (i.e. derived value or ratio cannot be given due to low concentration in original measure)"
0 Related Data-Fields
There are no related data-fields
0 Resources
There are no matching Resources
