Data
162,490 items of data are available, covering 153,106 participants.
Some values have special meanings defined by Data-Coding
41.
Defined-instances run from 0 to 1, labelled using Instancing
1.
Units of measurement are %.
| Maximum | 77.0766 |
| Decile 9 | 8.05133 |
| Decile 8 | 7.2227 |
| Decile 7 | 6.70288 |
| Decile 6 | 6.30583 |
| Median | 5.96007 |
| Decile 4 | 5.63081 |
| Decile 3 | 5.29319 |
| Decile 2 | 4.90693 |
| Decile 1 | 4.38139 |
| Minimum | 0.760206 |
|

|
- Mean = 6.14218
- Std.dev = 1.59627
- 1053 items above graph maximum of 11.7213
- 1569 items have value -3 (indicates value was rejected by automatic sample and measurement quality control)
|
2 Instances
Instance 0 : Baseline (1998-2004)
152,833 participants, 151,570 items
| Maximum | 77.0766 |
| Decile 9 | 8.07995 |
| Decile 8 | 7.24532 |
| Decile 7 | 6.72204 |
| Decile 6 | 6.32102 |
| Median | 5.97117 |
| Decile 4 | 5.63879 |
| Decile 3 | 5.29802 |
| Decile 2 | 4.90894 |
| Decile 1 | 4.37742 |
| Minimum | 0.760206 |
|

|
- Mean = 6.15427
- Std.dev = 1.60882
- 985 items above graph maximum of 11.7825
- 1263 items have value -3 (indicates value was rejected by automatic sample and measurement quality control)
|
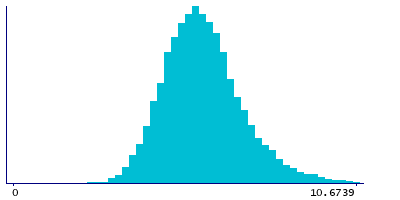
Instance 1 : Resurvey (2015-2019)
9,657 participants, 9,351 items
| Maximum | 24.8999 |
| Decile 9 | 7.55655 |
| Decile 8 | 6.85255 |
| Decile 7 | 6.43206 |
| Decile 6 | 6.1035 |
| Median | 5.80385 |
| Decile 4 | 5.5183 |
| Decile 3 | 5.22391 |
| Decile 2 | 4.88631 |
| Decile 1 | 4.43915 |
| Minimum | 1.73166 |
|
|
- Mean = 5.94626
- Std.dev = 1.36219
- 68 items above graph maximum of 10.6739
- 306 items have value -3 (indicates value was rejected by automatic sample and measurement quality control)
|
Notes
Triglycerides to total lipids ratio in small HDL (S-HDL-TG %) (%)
Coding 41 defines 5 special values:
- -5 represents "indicates derived value or ratio cannot be computed (missing code I)"
- -4 represents "indicates value not available (missing code A)"
- -3 represents "indicates value was rejected by automatic sample and measurement quality control"
- -2 represents "indicates a measurement cannot be quantified due to detected irregularity in sample - see tags"
- -1 represents "indicates a measurement not defined (i.e. derived value or ratio cannot be given due to low concentration in original measure)"
0 Related Data-Fields
There are no related data-fields
0 Resources
There are no matching Resources
