Data
162,490 items of data are available, covering 153,106 participants.
Some values have special meanings defined by Data-Coding
41.
Defined-instances run from 0 to 1, labelled using Instancing
1.
Units of measurement are mmol/l.
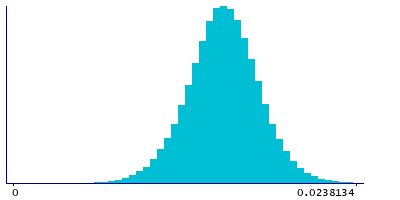
| Maximum | 0.0293195 |
| Decile 9 | 0.0176395 |
| Decile 8 | 0.016572 |
| Decile 7 | 0.0158129 |
| Decile 6 | 0.0151784 |
| Median | 0.0145872 |
| Decile 4 | 0.0139951 |
| Decile 3 | 0.0133623 |
| Decile 2 | 0.0125898 |
| Decile 1 | 0.0114655 |
| Minimum | 0.00114027 |
|
|
- Mean = 0.0145704
- Std.dev = 0.00247218
- 87 items above graph maximum of 0.0238134
- 1569 items have value -3 (indicates value was rejected by automatic sample and measurement quality control)
|
2 Instances
Instance 0 : Baseline (1998-2004)
152,833 participants, 151,570 items
| Maximum | 0.0293195 |
| Decile 9 | 0.0176142 |
| Decile 8 | 0.016539 |
| Decile 7 | 0.0157824 |
| Decile 6 | 0.0151482 |
| Median | 0.0145557 |
| Decile 4 | 0.0139675 |
| Decile 3 | 0.0133325 |
| Decile 2 | 0.0125587 |
| Decile 1 | 0.0114265 |
| Minimum | 0.00114027 |
|

|
- Mean = 0.0145395
- Std.dev = 0.00247557
- 82 items above graph maximum of 0.0238019
- 1263 items have value -3 (indicates value was rejected by automatic sample and measurement quality control)
|
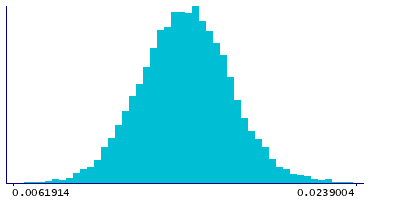
Instance 1 : Resurvey (2015-2019)
9,657 participants, 9,351 items
| Maximum | 0.0247524 |
| Decile 9 | 0.0179974 |
| Decile 8 | 0.0169952 |
| Decile 7 | 0.0162808 |
| Decile 6 | 0.0156569 |
| Median | 0.0150673 |
| Decile 4 | 0.0144814 |
| Decile 3 | 0.013858 |
| Decile 2 | 0.0131364 |
| Decile 1 | 0.0120944 |
| Minimum | 0.00306747 |
|
|
- Mean = 0.0150709
- Std.dev = 0.00236105
- 8 items below graph minimum of 0.0061914
- 5 items above graph maximum of 0.0239004
- 306 items have value -3 (indicates value was rejected by automatic sample and measurement quality control)
|
Notes
Total concentration of lipoprotein particles (Total-P) (mmol/l)
Coding 41 defines 5 special values:
- -5 represents "indicates derived value or ratio cannot be computed (missing code I)"
- -4 represents "indicates value not available (missing code A)"
- -3 represents "indicates value was rejected by automatic sample and measurement quality control"
- -2 represents "indicates a measurement cannot be quantified due to detected irregularity in sample - see tags"
- -1 represents "indicates a measurement not defined (i.e. derived value or ratio cannot be given due to low concentration in original measure)"
0 Related Data-Fields
There are no related data-fields
0 Resources
There are no matching Resources
