Data
162,487 items of data are available, covering 153,103 participants.
Some values have special meanings defined by Data-Coding
41.
Defined-instances run from 0 to 1, labelled using Instancing
1.
Units of measurement are %.
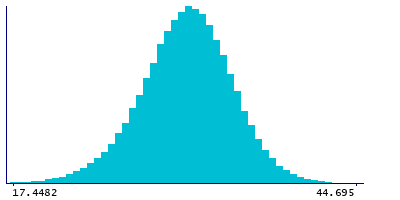
| Maximum | 47.8328 |
| Decile 9 | 35.6127 |
| Decile 8 | 34.1431 |
| Decile 7 | 33.0765 |
| Decile 6 | 32.1576 |
| Median | 31.2917 |
| Decile 4 | 30.4057 |
| Decile 3 | 29.4374 |
| Decile 2 | 28.2636 |
| Decile 1 | 26.5305 |
| Minimum | 0.0836552 |
|
|
- Mean = 31.1567
- Std.dev = 3.639
- 131 items below graph minimum of 17.4482
- 33 items above graph maximum of 44.695
- 1740 items have value -3 (indicates value was rejected by automatic sample and measurement quality control)
|
2 Instances
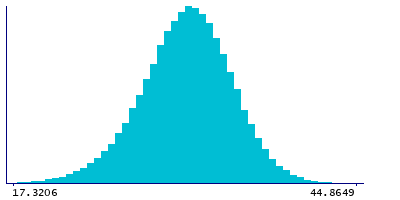
Instance 0 : Baseline (1998-2004)
152,830 participants, 151,425 items
| Maximum | 47.8328 |
| Decile 9 | 35.6835 |
| Decile 8 | 34.2124 |
| Decile 7 | 33.1401 |
| Decile 6 | 32.2114 |
| Median | 31.335 |
| Decile 4 | 30.4425 |
| Decile 3 | 29.4558 |
| Decile 2 | 28.2638 |
| Decile 1 | 26.502 |
| Minimum | 0.0836552 |
|
|
- Mean = 31.1894
- Std.dev = 3.67239
- 122 items below graph minimum of 17.3206
- 29 items above graph maximum of 44.8649
- 1405 items have value -3 (indicates value was rejected by automatic sample and measurement quality control)
|
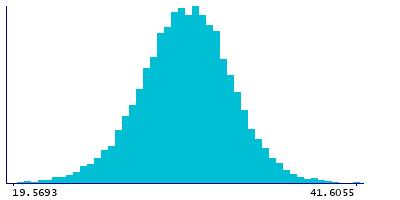
Instance 1 : Resurvey (2015-2019)
9,657 participants, 9,322 items
| Maximum | 42.7175 |
| Decile 9 | 34.2601 |
| Decile 8 | 33.0418 |
| Decile 7 | 32.1878 |
| Decile 6 | 31.417 |
| Median | 30.7129 |
| Decile 4 | 29.9756 |
| Decile 3 | 29.1875 |
| Decile 2 | 28.2632 |
| Decile 1 | 26.9147 |
| Minimum | 0.418236 |
|
|
- Mean = 30.6257
- Std.dev = 2.99625
- 13 items below graph minimum of 19.5693
- 2 items above graph maximum of 41.6055
- 335 items have value -3 (indicates value was rejected by automatic sample and measurement quality control)
|
Notes
Ratio of linoleic acid to total fatty acids (LA %) (%)
Coding 41 defines 5 special values:
- -5 represents "indicates derived value or ratio cannot be computed (missing code I)"
- -4 represents "indicates value not available (missing code A)"
- -3 represents "indicates value was rejected by automatic sample and measurement quality control"
- -2 represents "indicates a measurement cannot be quantified due to detected irregularity in sample - see tags"
- -1 represents "indicates a measurement not defined (i.e. derived value or ratio cannot be given due to low concentration in original measure)"
0 Related Data-Fields
There are no related data-fields
0 Resources
There are no matching Resources
