Data
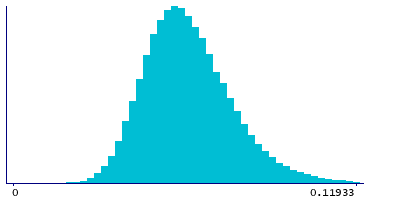
162,470 items of data are available, covering 153,086 participants.
Some values have special meanings defined by Data-Coding
41.
Defined-instances run from 0 to 1, labelled using Instancing
1.
Units of measurement are mmol/l.
| Maximum | 1.00374 |
| Decile 9 | 0.08112 |
| Decile 8 | 0.0729132 |
| Decile 7 | 0.0674515 |
| Decile 6 | 0.0631472 |
| Median | 0.059324 |
| Decile 4 | 0.0557636 |
| Decile 3 | 0.0521318 |
| Decile 2 | 0.048137 |
| Decile 1 | 0.0429106 |
| Minimum | 0.00728947 |
|

|
- Mean = 0.0610507
- Std.dev = 0.0158276
- 489 items above graph maximum of 0.11933
- 1611 items have value -3 (indicates value was rejected by automatic sample and measurement quality control)
- 68 items have value -2 (indicates a measurement cannot be quantified due to detected irregularity in sample - see tags)
|
2 Instances
Instance 0 : Baseline (1998-2004)
152,813 participants, 151,275 items
| Maximum | 1.00374 |
| Decile 9 | 0.0802065 |
| Decile 8 | 0.0721974 |
| Decile 7 | 0.0668173 |
| Decile 6 | 0.0625869 |
| Median | 0.0588715 |
| Decile 4 | 0.0553766 |
| Decile 3 | 0.0518182 |
| Decile 2 | 0.0478873 |
| Decile 1 | 0.0427145 |
| Minimum | 0.00728947 |
|

|
- Mean = 0.0605474
- Std.dev = 0.0155756
- 489 items above graph maximum of 0.117699
- 1471 items have value -3 (indicates value was rejected by automatic sample and measurement quality control)
- 67 items have value -2 (indicates a measurement cannot be quantified due to detected irregularity in sample - see tags)
|
Instance 1 : Resurvey (2015-2019)
9,657 participants, 9,516 items
| Maximum | 0.212037 |
| Decile 9 | 0.0913636 |
| Decile 8 | 0.0828367 |
| Decile 7 | 0.0768873 |
| Decile 6 | 0.0722245 |
| Median | 0.0679992 |
| Decile 4 | 0.0639156 |
| Decile 3 | 0.0596308 |
| Decile 2 | 0.0544569 |
| Decile 1 | 0.0474699 |
| Minimum | 0.0190381 |
|

|
- Mean = 0.0690515
- Std.dev = 0.0175574
- 20 items above graph maximum of 0.135257
- 140 items have value -3 (indicates value was rejected by automatic sample and measurement quality control)
- 1 items have value -2 (indicates a measurement cannot be quantified due to detected irregularity in sample - see tags)
|
Notes
Phenylalanine (Phe) (mmol/l)
Coding 41 defines 5 special values:
- -5 represents "indicates derived value or ratio cannot be computed (missing code I)"
- -4 represents "indicates value not available (missing code A)"
- -3 represents "indicates value was rejected by automatic sample and measurement quality control"
- -2 represents "indicates a measurement cannot be quantified due to detected irregularity in sample - see tags"
- -1 represents "indicates a measurement not defined (i.e. derived value or ratio cannot be given due to low concentration in original measure)"
0 Related Data-Fields
There are no related data-fields
0 Resources
There are no matching Resources


