Data
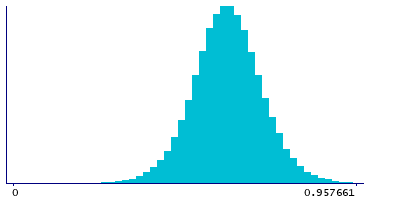
162,490 items of data are available, covering 153,106 participants.
Some values have special meanings defined by Data-Coding
41.
Defined-instances run from 0 to 1, labelled using Instancing
1.
Units of measurement are mmol/l.
| Maximum | 1.34724 |
| Decile 9 | 0.718174 |
| Decile 8 | 0.674619 |
| Decile 7 | 0.644818 |
| Decile 6 | 0.619927 |
| Median | 0.596883 |
| Decile 4 | 0.573857 |
| Decile 3 | 0.549389 |
| Decile 2 | 0.520519 |
| Decile 1 | 0.478687 |
| Minimum | 0.0967635 |
|

|
- Mean = 0.597712
- Std.dev = 0.096246
- 138 items above graph maximum of 0.957661
- 1569 items have value -3 (indicates value was rejected by automatic sample and measurement quality control)
|
2 Instances
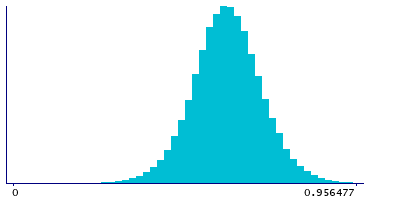
Instance 0 : Baseline (1998-2004)
152,833 participants, 151,570 items
| Maximum | 1.34724 |
| Decile 9 | 0.716837 |
| Decile 8 | 0.673126 |
| Decile 7 | 0.643267 |
| Decile 6 | 0.618481 |
| Median | 0.595447 |
| Decile 4 | 0.572448 |
| Decile 3 | 0.547972 |
| Decile 2 | 0.519188 |
| Decile 1 | 0.477197 |
| Minimum | 0.0967635 |
|

|
- Mean = 0.596297
- Std.dev = 0.0962846
- 134 items above graph maximum of 0.956477
- 1263 items have value -3 (indicates value was rejected by automatic sample and measurement quality control)
|
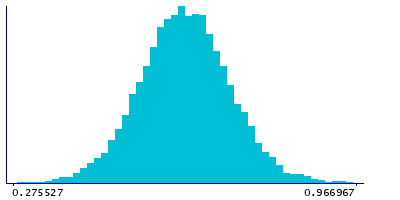
Instance 1 : Resurvey (2015-2019)
9,657 participants, 9,351 items
| Maximum | 1.01287 |
| Decile 9 | 0.736487 |
| Decile 8 | 0.695404 |
| Decile 7 | 0.666808 |
| Decile 6 | 0.643564 |
| Median | 0.619862 |
| Decile 4 | 0.598014 |
| Decile 3 | 0.573519 |
| Decile 2 | 0.545799 |
| Decile 1 | 0.506007 |
| Minimum | 0.138079 |
|

|
- Mean = 0.620654
- Std.dev = 0.0926493
- 8 items below graph minimum of 0.275527
- 4 items above graph maximum of 0.966967
- 306 items have value -3 (indicates value was rejected by automatic sample and measurement quality control)
|
Notes
Phospholipids in small HDL (S-HDL-PL) (mmol/l)
Coding 41 defines 5 special values:
- -5 represents "indicates derived value or ratio cannot be computed (missing code I)"
- -4 represents "indicates value not available (missing code A)"
- -3 represents "indicates value was rejected by automatic sample and measurement quality control"
- -2 represents "indicates a measurement cannot be quantified due to detected irregularity in sample - see tags"
- -1 represents "indicates a measurement not defined (i.e. derived value or ratio cannot be given due to low concentration in original measure)"
0 Related Data-Fields
There are no related data-fields
0 Resources
There are no matching Resources


