Data
162,490 items of data are available, covering 153,106 participants.
Some values have special meanings defined by Data-Coding
41.
Defined-instances run from 0 to 1, labelled using Instancing
1.
Units of measurement are %.
| Maximum | 43.8719 |
| Decile 9 | 24.9383 |
| Decile 8 | 24.1441 |
| Decile 7 | 23.5782 |
| Decile 6 | 23.0875 |
| Median | 22.6374 |
| Decile 4 | 22.1858 |
| Decile 3 | 21.6955 |
| Decile 2 | 21.1148 |
| Decile 1 | 20.2523 |
| Minimum | 0.00387823 |
|
|
- Mean = 22.6
- Std.dev = 1.93077
- 344 items below graph minimum of 15.5664
- 202 items above graph maximum of 29.6242
- 1579 items have value -3 (indicates value was rejected by automatic sample and measurement quality control)
|
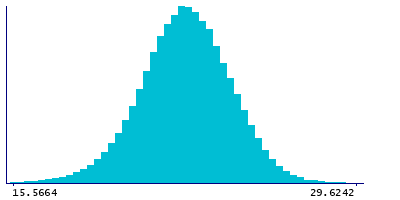
2 Instances
Instance 0 : Baseline (1998-2004)
152,833 participants, 151,561 items
| Maximum | 43.6954 |
| Decile 9 | 24.9263 |
| Decile 8 | 24.1343 |
| Decile 7 | 23.571 |
| Decile 6 | 23.0817 |
| Median | 22.6311 |
| Decile 4 | 22.1782 |
| Decile 3 | 21.6865 |
| Decile 2 | 21.1046 |
| Decile 1 | 20.2353 |
| Minimum | 0.00387823 |
|

|
- Mean = 22.5886
- Std.dev = 1.9331
- 331 items below graph minimum of 15.5443
- 185 items above graph maximum of 29.6173
- 1272 items have value -3 (indicates value was rejected by automatic sample and measurement quality control)
|
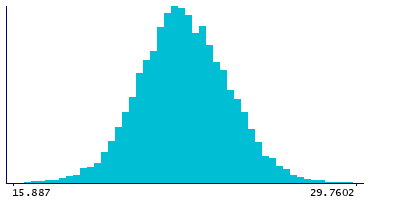
Instance 1 : Resurvey (2015-2019)
9,657 participants, 9,350 items
| Maximum | 43.8719 |
| Decile 9 | 25.1358 |
| Decile 8 | 24.3074 |
| Decile 7 | 23.6968 |
| Decile 6 | 23.1997 |
| Median | 22.7365 |
| Decile 4 | 22.2994 |
| Decile 3 | 21.8389 |
| Decile 2 | 21.2681 |
| Decile 1 | 20.5114 |
| Minimum | 11.9323 |
|
|
- Mean = 22.7845
- Std.dev = 1.88301
- 8 items below graph minimum of 15.887
- 17 items above graph maximum of 29.7602
- 307 items have value -3 (indicates value was rejected by automatic sample and measurement quality control)
|
Notes
Phospholipids to total lipids ratio in medium VLDL (M-VLDL-PL %) (%)
Coding 41 defines 5 special values:
- -5 represents "indicates derived value or ratio cannot be computed (missing code I)"
- -4 represents "indicates value not available (missing code A)"
- -3 represents "indicates value was rejected by automatic sample and measurement quality control"
- -2 represents "indicates a measurement cannot be quantified due to detected irregularity in sample - see tags"
- -1 represents "indicates a measurement not defined (i.e. derived value or ratio cannot be given due to low concentration in original measure)"
0 Related Data-Fields
There are no related data-fields
0 Resources
There are no matching Resources
