Data
162,490 items of data are available, covering 153,106 participants.
Some values have special meanings defined by Data-Coding
41.
Defined-instances run from 0 to 1, labelled using Instancing
1.
Units of measurement are %.
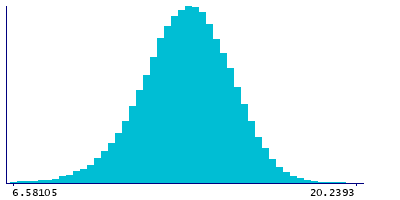
| Maximum | 27.8026 |
| Decile 9 | 15.6866 |
| Decile 8 | 14.9613 |
| Decile 7 | 14.4162 |
| Decile 6 | 13.9512 |
| Median | 13.5083 |
| Decile 4 | 13.0607 |
| Decile 3 | 12.571 |
| Decile 2 | 11.9924 |
| Decile 1 | 11.1338 |
| Minimum | 0.594571 |
|
|
- Mean = 13.4373
- Std.dev = 1.85318
- 388 items below graph minimum of 6.58105
- 114 items above graph maximum of 20.2393
- 1579 items have value -3 (indicates value was rejected by automatic sample and measurement quality control)
|
2 Instances
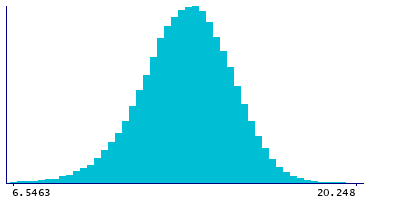
Instance 0 : Baseline (1998-2004)
152,833 participants, 151,561 items
| Maximum | 27.8026 |
| Decile 9 | 15.6808 |
| Decile 8 | 14.9549 |
| Decile 7 | 14.4125 |
| Decile 6 | 13.9461 |
| Median | 13.5014 |
| Decile 4 | 13.0509 |
| Decile 3 | 12.5603 |
| Decile 2 | 11.9765 |
| Decile 1 | 11.1136 |
| Minimum | 0.594571 |
|
|
- Mean = 13.4264
- Std.dev = 1.85941
- 370 items below graph minimum of 6.5463
- 107 items above graph maximum of 20.248
- 1272 items have value -3 (indicates value was rejected by automatic sample and measurement quality control)
|
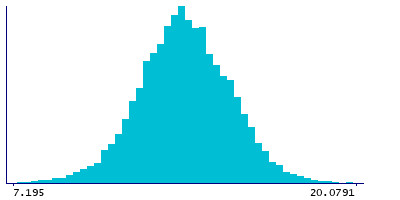
Instance 1 : Resurvey (2015-2019)
9,657 participants, 9,350 items
| Maximum | 24.1344 |
| Decile 9 | 15.7844 |
| Decile 8 | 15.057 |
| Decile 7 | 14.4847 |
| Decile 6 | 14.0318 |
| Median | 13.5954 |
| Decile 4 | 13.1946 |
| Decile 3 | 12.7608 |
| Decile 2 | 12.231 |
| Decile 1 | 11.4897 |
| Minimum | 3.63377 |
|
|
- Mean = 13.613
- Std.dev = 1.73967
- 9 items below graph minimum of 7.195
- 7 items above graph maximum of 20.0791
- 307 items have value -3 (indicates value was rejected by automatic sample and measurement quality control)
|
Notes
Free cholesterol to total lipids ratio in medium VLDL (M-VLDL-FC %) (%)
Coding 41 defines 5 special values:
- -5 represents "indicates derived value or ratio cannot be computed (missing code I)"
- -4 represents "indicates value not available (missing code A)"
- -3 represents "indicates value was rejected by automatic sample and measurement quality control"
- -2 represents "indicates a measurement cannot be quantified due to detected irregularity in sample - see tags"
- -1 represents "indicates a measurement not defined (i.e. derived value or ratio cannot be given due to low concentration in original measure)"
0 Related Data-Fields
There are no related data-fields
0 Resources
There are no matching Resources
