Data
162,490 items of data are available, covering 153,106 participants.
Some values have special meanings defined by Data-Coding
41.
Defined-instances run from 0 to 1, labelled using Instancing
1.
Units of measurement are %.
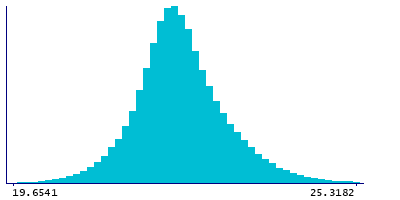
| Maximum | 91.0523 |
| Decile 9 | 23.4301 |
| Decile 8 | 22.9958 |
| Decile 7 | 22.726 |
| Decile 6 | 22.5311 |
| Median | 22.3669 |
| Decile 4 | 22.2135 |
| Decile 3 | 22.0533 |
| Decile 2 | 21.8562 |
| Decile 1 | 21.5421 |
| Minimum | 0.00576548 |
|
|
- Mean = 22.4696
- Std.dev = 1.10629
- 58 items below graph minimum of 19.6541
- 1326 items above graph maximum of 25.3182
- 1574 items have value -3 (indicates value was rejected by automatic sample and measurement quality control)
|
2 Instances
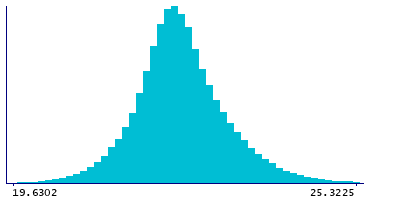
Instance 0 : Baseline (1998-2004)
152,833 participants, 151,565 items
| Maximum | 72.2421 |
| Decile 9 | 23.425 |
| Decile 8 | 22.9919 |
| Decile 7 | 22.7239 |
| Decile 6 | 22.5293 |
| Median | 22.3648 |
| Decile 4 | 22.2111 |
| Decile 3 | 22.0493 |
| Decile 2 | 21.8492 |
| Decile 1 | 21.5276 |
| Minimum | 0.00576548 |
|
|
- Mean = 22.4649
- Std.dev = 1.10067
- 52 items below graph minimum of 19.6302
- 1272 items above graph maximum of 25.3225
- 1268 items have value -3 (indicates value was rejected by automatic sample and measurement quality control)
|
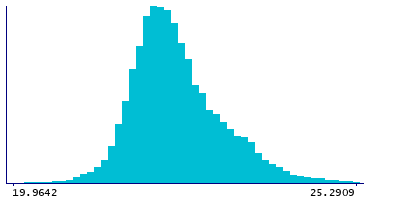
Instance 1 : Resurvey (2015-2019)
9,657 participants, 9,351 items
| Maximum | 91.0523 |
| Decile 9 | 23.5153 |
| Decile 8 | 23.067 |
| Decile 7 | 22.7674 |
| Decile 6 | 22.5622 |
| Median | 22.3979 |
| Decile 4 | 22.2525 |
| Decile 3 | 22.1048 |
| Decile 2 | 21.9534 |
| Decile 1 | 21.7398 |
| Minimum | 19.7616 |
|
|
- Mean = 22.5458
- Std.dev = 1.19104
- 2 items below graph minimum of 19.9642
- 53 items above graph maximum of 25.2909
- 306 items have value -3 (indicates value was rejected by automatic sample and measurement quality control)
|
Notes
Phospholipids to total lipids ratio in large LDL (L-LDL-PL %) (%)
Coding 41 defines 5 special values:
- -5 represents "indicates derived value or ratio cannot be computed (missing code I)"
- -4 represents "indicates value not available (missing code A)"
- -3 represents "indicates value was rejected by automatic sample and measurement quality control"
- -2 represents "indicates a measurement cannot be quantified due to detected irregularity in sample - see tags"
- -1 represents "indicates a measurement not defined (i.e. derived value or ratio cannot be given due to low concentration in original measure)"
0 Related Data-Fields
There are no related data-fields
0 Resources
There are no matching Resources
