Data
162,490 items of data are available, covering 153,106 participants.
Some values have special meanings defined by Data-Coding
41.
Defined-instances run from 0 to 1, labelled using Instancing
1.
Units of measurement are %.
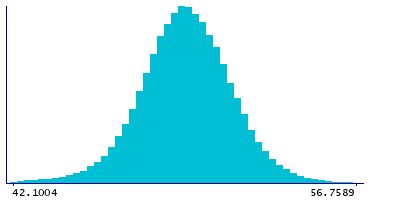
| Maximum | 77.9927 |
| Decile 9 | 51.8727 |
| Decile 8 | 51.0342 |
| Decile 7 | 50.4406 |
| Decile 6 | 49.9332 |
| Median | 49.4633 |
| Decile 4 | 48.9997 |
| Decile 3 | 48.4945 |
| Decile 2 | 47.8952 |
| Decile 1 | 46.9866 |
| Minimum | 0 |
|
|
- Mean = 49.3711
- Std.dev = 2.47976
- 1049 items below graph minimum of 42.1004
- 98 items above graph maximum of 56.7589
- 1583 items have value -3 (indicates value was rejected by automatic sample and measurement quality control)
|
2 Instances
Instance 0 : Baseline (1998-2004)
152,833 participants, 151,557 items
| Maximum | 75.1822 |
| Decile 9 | 51.858 |
| Decile 8 | 51.0053 |
| Decile 7 | 50.406 |
| Decile 6 | 49.8989 |
| Median | 49.4305 |
| Decile 4 | 48.9716 |
| Decile 3 | 48.4692 |
| Decile 2 | 47.8705 |
| Decile 1 | 46.967 |
| Minimum | 0 |
|

|
- Mean = 49.3448
- Std.dev = 2.49209
- 990 items below graph minimum of 42.076
- 92 items above graph maximum of 56.7489
- 1276 items have value -3 (indicates value was rejected by automatic sample and measurement quality control)
|
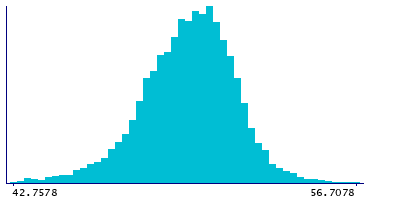
Instance 1 : Resurvey (2015-2019)
9,657 participants, 9,350 items
| Maximum | 77.9927 |
| Decile 9 | 52.0578 |
| Decile 8 | 51.3907 |
| Decile 7 | 50.886 |
| Decile 6 | 50.4465 |
| Median | 49.9978 |
| Decile 4 | 49.5227 |
| Decile 3 | 48.9735 |
| Decile 2 | 48.3445 |
| Decile 1 | 47.4078 |
| Minimum | 8.28839e-10 |
|
|
- Mean = 49.7972
- Std.dev = 2.22762
- 65 items below graph minimum of 42.7578
- 9 items above graph maximum of 56.7078
- 307 items have value -3 (indicates value was rejected by automatic sample and measurement quality control)
|
Notes
Cholesteryl esters to total lipids ratio in medium LDL (M-LDL-CE %) (%)
Coding 41 defines 5 special values:
- -5 represents "indicates derived value or ratio cannot be computed (missing code I)"
- -4 represents "indicates value not available (missing code A)"
- -3 represents "indicates value was rejected by automatic sample and measurement quality control"
- -2 represents "indicates a measurement cannot be quantified due to detected irregularity in sample - see tags"
- -1 represents "indicates a measurement not defined (i.e. derived value or ratio cannot be given due to low concentration in original measure)"
0 Related Data-Fields
There are no related data-fields
0 Resources
There are no matching Resources
