Data
162,490 items of data are available, covering 153,106 participants.
Some values have special meanings defined by Data-Coding
41.
Defined-instances run from 0 to 1, labelled using Instancing
1.
Units of measurement are %.
| Maximum | 90.8935 |
| Decile 9 | 33.1881 |
| Decile 8 | 32.2659 |
| Decile 7 | 31.7178 |
| Decile 6 | 31.2928 |
| Median | 30.9239 |
| Decile 4 | 30.5779 |
| Decile 3 | 30.2075 |
| Decile 2 | 29.7753 |
| Decile 1 | 29.1425 |
| Minimum | 0.000321584 |
|

|
- Mean = 31.0904
- Std.dev = 1.93952
- 319 items below graph minimum of 25.097
- 1243 items above graph maximum of 37.2337
- 1578 items have value -3 (indicates value was rejected by automatic sample and measurement quality control)
|
2 Instances
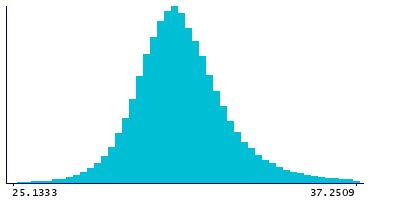
Instance 0 : Baseline (1998-2004)
152,833 participants, 151,561 items
| Maximum | 90.8935 |
| Decile 9 | 33.2117 |
| Decile 8 | 32.2877 |
| Decile 7 | 31.739 |
| Decile 6 | 31.3143 |
| Median | 30.9459 |
| Decile 4 | 30.5993 |
| Decile 3 | 30.2304 |
| Decile 2 | 29.7978 |
| Decile 1 | 29.1725 |
| Minimum | 0.000321584 |
|
|
- Mean = 31.116
- Std.dev = 1.92963
- 291 items below graph minimum of 25.1333
- 1193 items above graph maximum of 37.2509
- 1272 items have value -3 (indicates value was rejected by automatic sample and measurement quality control)
|
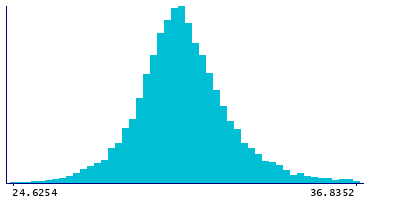
Instance 1 : Resurvey (2015-2019)
9,657 participants, 9,351 items
| Maximum | 87.4057 |
| Decile 9 | 32.7653 |
| Decile 8 | 31.8603 |
| Decile 7 | 31.3407 |
| Decile 6 | 30.9156 |
| Median | 30.5652 |
| Decile 4 | 30.233 |
| Decile 3 | 29.8715 |
| Decile 2 | 29.4261 |
| Decile 1 | 28.6953 |
| Minimum | 0.000448091 |
|
|
- Mean = 30.6746
- Std.dev = 2.04889
- 25 items below graph minimum of 24.6254
- 55 items above graph maximum of 36.8352
- 306 items have value -3 (indicates value was rejected by automatic sample and measurement quality control)
|
Notes
Phospholipids to total lipids ratio in small LDL (S-LDL-PL %) (%)
Coding 41 defines 5 special values:
- -5 represents "indicates derived value or ratio cannot be computed (missing code I)"
- -4 represents "indicates value not available (missing code A)"
- -3 represents "indicates value was rejected by automatic sample and measurement quality control"
- -2 represents "indicates a measurement cannot be quantified due to detected irregularity in sample - see tags"
- -1 represents "indicates a measurement not defined (i.e. derived value or ratio cannot be given due to low concentration in original measure)"
0 Related Data-Fields
There are no related data-fields
0 Resources
There are no matching Resources
