Data
162,490 items of data are available, covering 153,106 participants.
Some values have special meanings defined by Data-Coding
41.
Defined-instances run from 0 to 1, labelled using Instancing
1.
Units of measurement are %.
| Maximum | 99.9997 |
| Decile 9 | 49.546 |
| Decile 8 | 48.1496 |
| Decile 7 | 47.0378 |
| Decile 6 | 46.0216 |
| Median | 44.9943 |
| Decile 4 | 43.8881 |
| Decile 3 | 42.594 |
| Decile 2 | 40.8725 |
| Decile 1 | 38.0709 |
| Minimum | 0.000153063 |
|

|
- Mean = 44.2329
- Std.dev = 5.45017
- 1482 items below graph minimum of 26.5957
- 452 items above graph maximum of 61.0211
- 1572 items have value -3 (indicates value was rejected by automatic sample and measurement quality control)
|
2 Instances
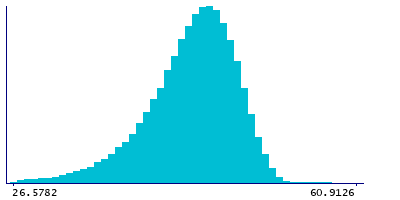
Instance 0 : Baseline (1998-2004)
152,833 participants, 151,567 items
| Maximum | 99.9997 |
| Decile 9 | 49.4678 |
| Decile 8 | 48.0721 |
| Decile 7 | 46.9645 |
| Decile 6 | 45.9545 |
| Median | 44.9328 |
| Decile 4 | 43.8255 |
| Decile 3 | 42.5358 |
| Decile 2 | 40.8205 |
| Decile 1 | 38.023 |
| Minimum | 0.000153063 |
|
|
- Mean = 44.1766
- Std.dev = 5.42852
- 1379 items below graph minimum of 26.5782
- 442 items above graph maximum of 60.9126
- 1266 items have value -3 (indicates value was rejected by automatic sample and measurement quality control)
|
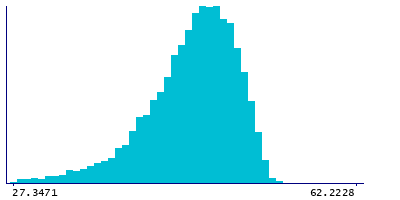
Instance 1 : Resurvey (2015-2019)
9,657 participants, 9,351 items
| Maximum | 89.9488 |
| Decile 9 | 50.5975 |
| Decile 8 | 49.3017 |
| Decile 7 | 48.1899 |
| Decile 6 | 47.1509 |
| Median | 46.1009 |
| Decile 4 | 44.9545 |
| Decile 3 | 43.6221 |
| Decile 2 | 41.8423 |
| Decile 1 | 38.9723 |
| Minimum | 0.00342568 |
|
|
- Mean = 45.1458
- Std.dev = 5.71282
- 107 items below graph minimum of 27.3471
- 12 items above graph maximum of 62.2228
- 306 items have value -3 (indicates value was rejected by automatic sample and measurement quality control)
|
Notes
Phospholipids to total lipids ratio in very large HDL (XL-HDL-PL %) (%)
Coding 41 defines 5 special values:
- -5 represents "indicates derived value or ratio cannot be computed (missing code I)"
- -4 represents "indicates value not available (missing code A)"
- -3 represents "indicates value was rejected by automatic sample and measurement quality control"
- -2 represents "indicates a measurement cannot be quantified due to detected irregularity in sample - see tags"
- -1 represents "indicates a measurement not defined (i.e. derived value or ratio cannot be given due to low concentration in original measure)"
0 Related Data-Fields
There are no related data-fields
0 Resources
There are no matching Resources
