Data
162,490 items of data are available, covering 153,106 participants.
Some values have special meanings defined by Data-Coding
41.
Defined-instances run from 0 to 1, labelled using Instancing
1.
Units of measurement are %.
| Maximum | 82.658 |
| Decile 9 | 50.1602 |
| Decile 8 | 49.4303 |
| Decile 7 | 48.933 |
| Decile 6 | 48.5212 |
| Median | 48.1377 |
| Decile 4 | 47.7627 |
| Decile 3 | 47.3743 |
| Decile 2 | 46.9331 |
| Decile 1 | 46.3668 |
| Minimum | 9.06802e-05 |
|
|
- Mean = 48.2777
- Std.dev = 1.95662
- 63 items below graph minimum of 42.5735
- 1043 items above graph maximum of 53.9536
- 1569 items have value -3 (indicates value was rejected by automatic sample and measurement quality control)
|
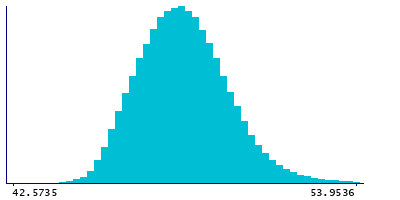
2 Instances
Instance 0 : Baseline (1998-2004)
152,833 participants, 151,570 items
| Maximum | 82.658 |
| Decile 9 | 50.1859 |
| Decile 8 | 49.4475 |
| Decile 7 | 48.9479 |
| Decile 6 | 48.5307 |
| Median | 48.1424 |
| Decile 4 | 47.7631 |
| Decile 3 | 47.3691 |
| Decile 2 | 46.9246 |
| Decile 1 | 46.3584 |
| Minimum | 9.06802e-05 |
|

|
- Mean = 48.2845
- Std.dev = 1.97267
- 61 items below graph minimum of 42.5309
- 999 items above graph maximum of 54.0134
- 1263 items have value -3 (indicates value was rejected by automatic sample and measurement quality control)
|
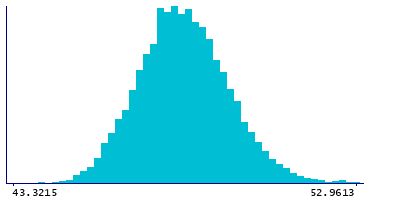
Instance 1 : Resurvey (2015-2019)
9,657 participants, 9,351 items
| Maximum | 79.8231 |
| Decile 9 | 49.748 |
| Decile 8 | 49.1568 |
| Decile 7 | 48.7442 |
| Decile 6 | 48.3888 |
| Median | 48.0713 |
| Decile 4 | 47.7563 |
| Decile 3 | 47.4365 |
| Decile 2 | 47.056 |
| Decile 1 | 46.5348 |
| Minimum | 26.1211 |
|
|
- Mean = 48.167
- Std.dev = 1.67122
- 2 items below graph minimum of 43.3215
- 42 items above graph maximum of 52.9613
- 306 items have value -3 (indicates value was rejected by automatic sample and measurement quality control)
|
Notes
Phospholipids to total lipids ratio in medium HDL (M-HDL-PL %) (%)
Coding 41 defines 5 special values:
- -5 represents "indicates derived value or ratio cannot be computed (missing code I)"
- -4 represents "indicates value not available (missing code A)"
- -3 represents "indicates value was rejected by automatic sample and measurement quality control"
- -2 represents "indicates a measurement cannot be quantified due to detected irregularity in sample - see tags"
- -1 represents "indicates a measurement not defined (i.e. derived value or ratio cannot be given due to low concentration in original measure)"
0 Related Data-Fields
There are no related data-fields
0 Resources
There are no matching Resources
