Data
162,490 items of data are available, covering 153,106 participants.
Some values have special meanings defined by Data-Coding
41.
Defined-instances run from 0 to 1, labelled using Instancing
1.
Units of measurement are g/l.
| Maximum | 2.50438 |
| Decile 9 | 1.4666 |
| Decile 8 | 1.37458 |
| Decile 7 | 1.31216 |
| Decile 6 | 1.26095 |
| Median | 1.21543 |
| Decile 4 | 1.16936 |
| Decile 3 | 1.12165 |
| Decile 2 | 1.06545 |
| Decile 1 | 0.985873 |
| Minimum | 0.13898 |
|
|
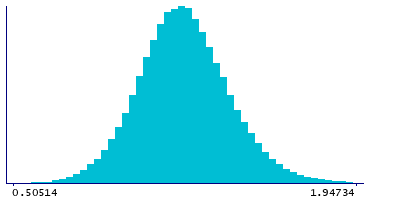
- Mean = 1.22181
- Std.dev = 0.193804
- 120 items below graph minimum of 0.50514
- 223 items above graph maximum of 1.94734
- 1569 items have value -3 (indicates value was rejected by automatic sample and measurement quality control)
|
2 Instances
Instance 0 : Baseline (1998-2004)
152,833 participants, 151,570 items
| Maximum | 2.50438 |
| Decile 9 | 1.46574 |
| Decile 8 | 1.37365 |
| Decile 7 | 1.31128 |
| Decile 6 | 1.26008 |
| Median | 1.21422 |
| Decile 4 | 1.16809 |
| Decile 3 | 1.12018 |
| Decile 2 | 1.06384 |
| Decile 1 | 0.983759 |
| Minimum | 0.13898 |
|

|
- Mean = 1.22058
- Std.dev = 0.194393
- 113 items below graph minimum of 0.501778
- 208 items above graph maximum of 1.94772
- 1263 items have value -3 (indicates value was rejected by automatic sample and measurement quality control)
|
Instance 1 : Resurvey (2015-2019)
9,657 participants, 9,351 items
| Maximum | 2.3057 |
| Decile 9 | 1.47865 |
| Decile 8 | 1.38621 |
| Decile 7 | 1.32527 |
| Decile 6 | 1.27494 |
| Median | 1.23239 |
| Decile 4 | 1.18999 |
| Decile 3 | 1.14211 |
| Decile 2 | 1.09211 |
| Decile 1 | 1.02347 |
| Minimum | 0.376726 |
|

|
- Mean = 1.24187
- Std.dev = 0.182825
- 5 items below graph minimum of 0.568275
- 15 items above graph maximum of 1.93384
- 306 items have value -3 (indicates value was rejected by automatic sample and measurement quality control)
|
Notes
Apolipoprotein A1 (ApoA1) (g/l)
Coding 41 defines 5 special values:
- -5 represents "indicates derived value or ratio cannot be computed (missing code I)"
- -4 represents "indicates value not available (missing code A)"
- -3 represents "indicates value was rejected by automatic sample and measurement quality control"
- -2 represents "indicates a measurement cannot be quantified due to detected irregularity in sample - see tags"
- -1 represents "indicates a measurement not defined (i.e. derived value or ratio cannot be given due to low concentration in original measure)"
0 Related Data-Fields
There are no related data-fields
0 Resources
There are no matching Resources
