Data
162,490 items of data are available, covering 153,106 participants.
Some values have special meanings defined by Data-Coding
41.
Defined-instances run from 0 to 1, labelled using Instancing
1.
Units of measurement are %.
| Maximum | 60.7777 |
| Decile 9 | 43.2987 |
| Decile 8 | 41.9764 |
| Decile 7 | 40.9481 |
| Decile 6 | 40.0392 |
| Median | 39.1581 |
| Decile 4 | 38.2433 |
| Decile 3 | 37.2433 |
| Decile 2 | 35.9915 |
| Decile 1 | 34.1191 |
| Minimum | 19.1492 |
|

|
- Mean = 38.8811
- Std.dev = 3.66344
- 191 items below graph minimum of 24.9394
- 3 items above graph maximum of 52.4784
- 3 items have value -4 (indicates value not available (missing code A))
- 1740 items have value -3 (indicates value was rejected by automatic sample and measurement quality control)
|
2 Instances
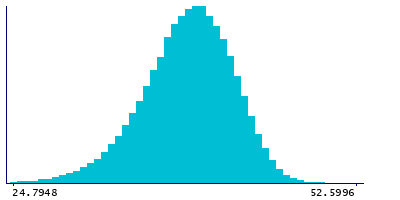
Instance 0 : Baseline (1998-2004)
152,833 participants, 151,425 items
| Maximum | 60.7777 |
| Decile 9 | 43.3314 |
| Decile 8 | 41.9991 |
| Decile 7 | 40.9581 |
| Decile 6 | 40.0407 |
| Median | 39.1535 |
| Decile 4 | 38.2308 |
| Decile 3 | 37.2232 |
| Decile 2 | 35.9539 |
| Decile 1 | 34.0631 |
| Minimum | 19.1492 |
|
|
- Mean = 38.8733
- Std.dev = 3.69557
- 172 items below graph minimum of 24.7948
- 3 items above graph maximum of 52.5996
- 3 items have value -4 (indicates value not available (missing code A))
- 1405 items have value -3 (indicates value was rejected by automatic sample and measurement quality control)
|
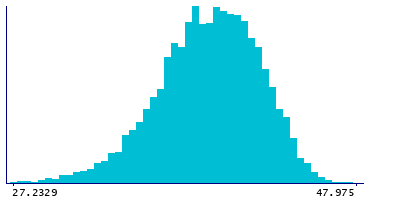
Instance 1 : Resurvey (2015-2019)
9,657 participants, 9,322 items
| Maximum | 47.975 |
| Decile 9 | 42.7833 |
| Decile 8 | 41.7056 |
| Decile 7 | 40.8291 |
| Decile 6 | 40.0132 |
| Median | 39.2266 |
| Decile 4 | 38.3789 |
| Decile 3 | 37.5582 |
| Decile 2 | 36.5499 |
| Decile 1 | 35.0081 |
| Minimum | 21.3998 |
|
|
- Mean = 39.0087
- Std.dev = 3.09235
- 11 items below graph minimum of 27.2329
- 335 items have value -3 (indicates value was rejected by automatic sample and measurement quality control)
|
Notes
Ratio of omega-6 fatty acids to total fatty acids (Omega-6 %) (%)
Coding 41 defines 5 special values:
- -5 represents "indicates derived value or ratio cannot be computed (missing code I)"
- -4 represents "indicates value not available (missing code A)"
- -3 represents "indicates value was rejected by automatic sample and measurement quality control"
- -2 represents "indicates a measurement cannot be quantified due to detected irregularity in sample - see tags"
- -1 represents "indicates a measurement not defined (i.e. derived value or ratio cannot be given due to low concentration in original measure)"
0 Related Data-Fields
There are no related data-fields
0 Resources
There are no matching Resources
