Data
162,490 items of data are available, covering 153,106 participants.
Some values have special meanings defined by Data-Coding
41.
Defined-instances run from 0 to 1, labelled using Instancing
1.
Units of measurement are mmol/l.
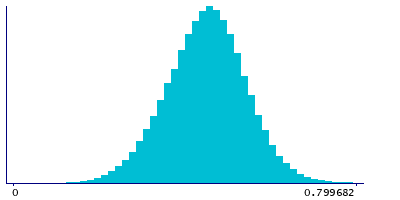
| Maximum | 1.1841 |
| Decile 9 | 0.564369 |
| Decile 8 | 0.52513 |
| Decile 7 | 0.497485 |
| Decile 6 | 0.473727 |
| Median | 0.451414 |
| Decile 4 | 0.428391 |
| Decile 3 | 0.403077 |
| Decile 2 | 0.372354 |
| Decile 1 | 0.329056 |
| Minimum | 0.0344542 |
|
|
- Mean = 0.4493
- Std.dev = 0.0930226
- 80 items above graph maximum of 0.799682
- 32 items have value -4 (indicates value not available (missing code A))
- 1737 items have value -3 (indicates value was rejected by automatic sample and measurement quality control)
- 5994 items have value -2 (indicates a measurement cannot be quantified due to detected irregularity in sample - see tags)
|
2 Instances
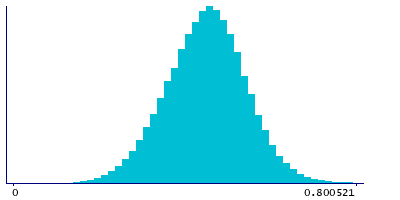
Instance 0 : Baseline (1998-2004)
152,833 participants, 145,655 items
| Maximum | 1.1841 |
| Decile 9 | 0.564652 |
| Decile 8 | 0.525439 |
| Decile 7 | 0.497773 |
| Decile 6 | 0.473974 |
| Median | 0.451527 |
| Decile 4 | 0.42825 |
| Decile 3 | 0.402672 |
| Decile 2 | 0.37183 |
| Decile 1 | 0.328782 |
| Minimum | 0.0344542 |
|
|
- Mean = 0.449376
- Std.dev = 0.0930064
- 71 items above graph maximum of 0.800521
- 32 items have value -4 (indicates value not available (missing code A))
- 1508 items have value -3 (indicates value was rejected by automatic sample and measurement quality control)
- 5638 items have value -2 (indicates a measurement cannot be quantified due to detected irregularity in sample - see tags)
|
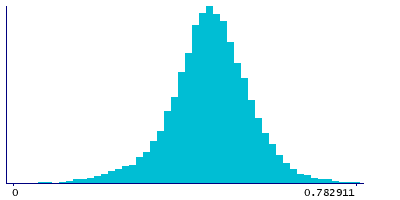
Instance 1 : Resurvey (2015-2019)
9,657 participants, 9,072 items
| Maximum | 0.863557 |
| Decile 9 | 0.55906 |
| Decile 8 | 0.519713 |
| Decile 7 | 0.492016 |
| Decile 6 | 0.470399 |
| Median | 0.449809 |
| Decile 4 | 0.430625 |
| Decile 3 | 0.408587 |
| Decile 2 | 0.381015 |
| Decile 1 | 0.335209 |
| Minimum | 0.0536498 |
|
|
- Mean = 0.448081
- Std.dev = 0.0932735
- 9 items above graph maximum of 0.782911
- 229 items have value -3 (indicates value was rejected by automatic sample and measurement quality control)
- 356 items have value -2 (indicates a measurement cannot be quantified due to detected irregularity in sample - see tags)
|
Notes
Glutamine (Gln) (mmol/l)
Coding 41 defines 5 special values:
- -5 represents "indicates derived value or ratio cannot be computed (missing code I)"
- -4 represents "indicates value not available (missing code A)"
- -3 represents "indicates value was rejected by automatic sample and measurement quality control"
- -2 represents "indicates a measurement cannot be quantified due to detected irregularity in sample - see tags"
- -1 represents "indicates a measurement not defined (i.e. derived value or ratio cannot be given due to low concentration in original measure)"
0 Related Data-Fields
There are no related data-fields
0 Resources
There are no matching Resources
