Data
269 items of data are available, covering 162 participants.
Defined-instances run from 29 to 31, labelled using Instancing
1.
Units of measurement are hours.
Data has not been summarised because combining instances would be misleading.
3 Instances
Instance 29 : 2020 - First covid questionnaire at age 74 years.
62 participants, 62 items
| Maximum | 45 |
| Decile 9 | 35.5 |
| Decile 8 | 30 |
| Decile 7 | 24.5 |
| Decile 6 | 20 |
| Median | 15 |
| Decile 4 | 13.5 |
| Decile 3 | 9 |
| Decile 2 | 7 |
| Decile 1 | 5 |
| Minimum | 2 |
|

|
- There are 20 distinct values.
- Mean = 18.629
- Std.dev = 11.9113
|
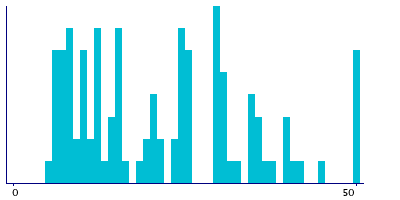
Instance 30 : 2020 - Second covid questionnaire at age 74 years.
108 participants, 108 items
| Maximum | 50 |
| Decile 9 | 40 |
| Decile 8 | 33.5 |
| Decile 7 | 30 |
| Decile 6 | 25 |
| Median | 21 |
| Decile 4 | 15 |
| Decile 3 | 12 |
| Decile 2 | 10 |
| Decile 1 | 7 |
| Minimum | 6 |
|
|
- There are 24 distinct values.
- Mean = 22.1759
- Std.dev = 12.4936
|
Instance 31 : 2021 - Third covid questionnaire at age 75 years.
99 participants, 99 items
| Maximum | 42 |
| Decile 9 | 36 |
| Decile 8 | 30 |
| Decile 7 | 30 |
| Decile 6 | 20.5 |
| Median | 16 |
| Decile 4 | 12 |
| Decile 3 | 10 |
| Decile 2 | 7.5 |
| Decile 1 | 6 |
| Minimum | 4 |
|

|
- There are 24 distinct values.
- Mean = 19.3636
- Std.dev = 11.6241
|
Notes
cw1_wrkhoursd - How many hours per week do you usually work now, not including meal breaks but including overtime - Covid wave 1 (age 74 years), cw2_wrkhoursd - How many hours per week do you usually work now, not including meal breaks but including overtime - Covid wave 2 (age 74 years), cw3_wrkhoursd - How many hours per week do you usually work now, not including meal breaks but including overtime - Covid wave 3 (age 75 years)
0 Related Data-Fields
There are no related data-fields
0 Resources
There are no matching Resources