Data
3,575 items of data are available, covering 2,023 participants.
Defined-instances run from 30 to 31, labelled using Instancing
1.
Units of measurement are portions.
Data has not been summarised because combining instances would be misleading.
2 Instances
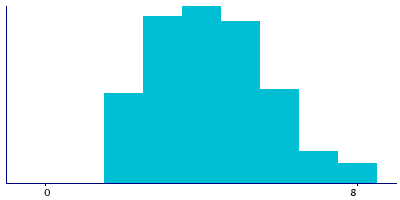
Instance 30 : 2020 - Second covid questionnaire at age 74 years.
1,895 participants, 1,895 items
| Maximum | 8 |
| Decile 9 | 6 |
| Decile 8 | 5 |
| Decile 7 | 5 |
| Decile 6 | 5 |
| Median | 4 |
| Decile 4 | 4 |
| Decile 3 | 3 |
| Decile 2 | 3 |
| Decile 1 | 2 |
| Minimum | 2 |
|
|
- There are 7 distinct values.
- Mean = 4.24327
- Std.dev = 1.48464
|
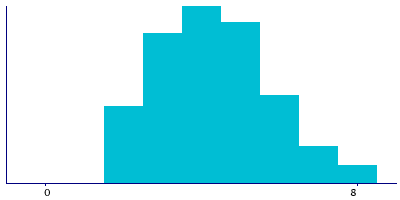
Instance 31 : 2021 - Third covid questionnaire at age 75 years.
1,680 participants, 1,680 items
| Maximum | 8 |
| Decile 9 | 6 |
| Decile 8 | 6 |
| Decile 7 | 5 |
| Decile 6 | 5 |
| Median | 4 |
| Decile 4 | 4 |
| Decile 3 | 3 |
| Decile 2 | 3 |
| Decile 1 | 2 |
| Minimum | 2 |
|
|
- There are 7 distinct values.
- Mean = 4.30417
- Std.dev = 1.4662
|
Notes
cw2_frtvegsp - In the last four weeks, how many portions of fresh fruit and vegetables have you eaten in a typical day - Covid wave 2 (age 74 years), cw3_frtvegsp - In the last four weeks, how many portions of fresh fruit and vegetables have you eaten in a typical day - Covid wave 3 (age 75 years)
0 Related Data-Fields
There are no related data-fields
0 Resources
There are no matching Resources