Data
14,816 items of data are available, covering 1,719 participants.
Some values have special meanings defined by Data-Coding
20069.
Defined-instances run from 40 to 50, labelled using Instancing
1.
Units of measurement are year.
Data has not been summarised because combining instances would be misleading.
10 Instances
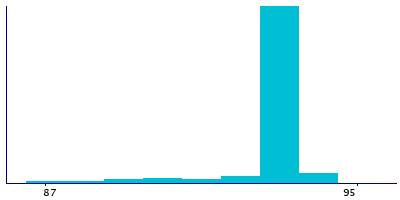
Instance 40 : 1993 - Women's health questionnaire at age 47 years
1,470 participants, 2,940 items
| Maximum | 95 |
| Decile 9 | 93 |
| Decile 8 | 93 |
| Decile 7 | 93 |
| Decile 6 | 93 |
| Median | 93 |
| Decile 4 | 93 |
| Decile 3 | 93 |
| Decile 2 | 93 |
| Decile 1 | 90 |
| Minimum | 74 |
|
|
- There are 22 distinct values.
- Mean = 92.1537
- Std.dev = 2.75696
- 166 items below graph minimum of 87
|
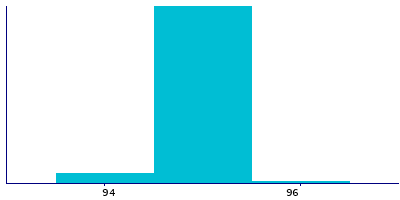
Instance 41 : 1994 - Women's health questionnaire at age 48 years
1,108 participants, 2,216 items
| Maximum | 95 |
| Decile 9 | 94 |
| Decile 8 | 94 |
| Decile 7 | 94 |
| Decile 6 | 94 |
| Median | 94 |
| Decile 4 | 94 |
| Decile 3 | 94 |
| Decile 2 | 94 |
| Decile 1 | 94 |
| Minimum | 46 |
|

|
- There are 20 distinct values.
- Mean = 93.6444
- Std.dev = 2.27526
- 82 items below graph minimum of 93
|
Instance 42 : 1995 - Women's health questionnaire at age 49 years
1,065 participants, 2,130 items
| Maximum | 96 |
| Decile 9 | 95 |
| Decile 8 | 95 |
| Decile 7 | 95 |
| Decile 6 | 95 |
| Median | 95 |
| Decile 4 | 95 |
| Decile 3 | 95 |
| Decile 2 | 95 |
| Decile 1 | 95 |
| Minimum | 75 |
|
|
- There are 16 distinct values.
- Mean = 94.6723
- Std.dev = 1.67013
- 90 items below graph minimum of 94
|
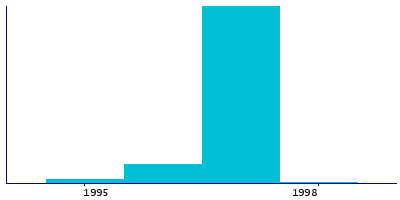
Instance 43 : 1996 - Women's health questionnaire at age 50 years
948 participants, 1,896 items
| Maximum | 1989 |
| Decile 9 | 1987 |
| Decile 8 | 1986.5 |
| Decile 7 | 1986 |
| Decile 6 | 1985 |
| Median | 1984 |
| Decile 4 | 1983 |
| Decile 3 | 1980.5 |
| Decile 2 | 1976 |
| Decile 1 | 1966 |
| Minimum | 1955 |
|

|
- There are 13 distinct values.
- Mean = 1980.71
- Std.dev = 8.56095
- 4 items have value 1988 (1988)
- 4 items have value 1990 (1990)
- 14 items have value 1991 (1991)
- 10 items have value 1992 (1992)
- 20 items have value 1993 (1993)
- 24 items have value 1994 (1994)
- 138 items have value 1995 (1995)
- 1616 items have value 1996 (1996)
- 18 items have value 1997 (1997)
|
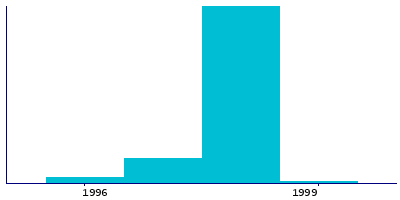
Instance 44 : 1997 - Women's health questionnaire at age 51 years
839 participants, 1,678 items
| Maximum | 1987 |
| Decile 9 | 1986 |
| Decile 8 | 1986 |
| Decile 7 | 1985 |
| Decile 6 | 1984.5 |
| Median | 1983 |
| Decile 4 | 1983 |
| Decile 3 | 1981.5 |
| Decile 2 | 1981 |
| Decile 1 | 1978.5 |
| Minimum | 1977 |
|
|
- There are 9 distinct values.
- Mean = 1983.29
- Std.dev = 2.73675
- 2 items have value 1975 (1975)
- 4 items have value 1988 (1988)
- 8 items have value 1990 (1990)
- 12 items have value 1991 (1991)
- 4 items have value 1992 (1992)
- 10 items have value 1993 (1993)
- 22 items have value 1994 (1994)
- 34 items have value 1995 (1995)
- 152 items have value 1996 (1996)
- 1392 items have value 1997 (1997)
- 10 items have value 1998 (1998)
|
Instance 45 : 1998 - Women's health questionnaire at age 52 years
655 participants, 1,310 items
| Maximum | 1989 |
| Decile 9 | 1987 |
| Decile 8 | 1986 |
| Decile 7 | 1984 |
| Decile 6 | 1982 |
| Median | 1982 |
| Decile 4 | 1981 |
| Decile 3 | 1979 |
| Decile 2 | 1978 |
| Decile 1 | 1978 |
| Minimum | 1978 |
|
|
- There are 8 distinct values.
- Mean = 1982.6
- Std.dev = 3.63868
- 2 items have value 1975 (1975)
- 2 items have value 1988 (1988)
- 2 items have value 1990 (1990)
- 10 items have value 1991 (1991)
- 10 items have value 1992 (1992)
- 6 items have value 1993 (1993)
- 6 items have value 1994 (1994)
- 24 items have value 1995 (1995)
- 36 items have value 1996 (1996)
- 148 items have value 1997 (1997)
- 1034 items have value 1998 (1998)
- 10 items have value 1999 (1999)
|
Instance 46 : 1999 - Women's health questionnaire at age 53 years
542 participants, 1,084 items
Too few values for statistical summary.
Instance 47 : 2000 - Women's health questionnaire at age 54 years
424 participants, 848 items
Too few values for statistical summary.
Instance 48 : 2003 - Women's health questionnaire at age 57 years
295 participants, 590 items
Too few values for statistical summary.
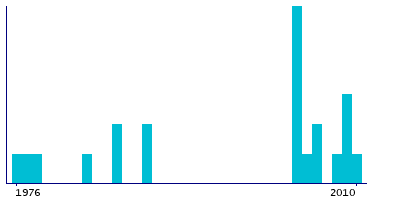
Instance 50 : 2006 - Women's health questionnaire at age 60-64 years
62 participants, 124 items
| Maximum | 2010 |
| Decile 9 | 2009 |
| Decile 8 | 2008 |
| Decile 7 | 2005.5 |
| Decile 6 | 2004 |
| Median | 2004 |
| Decile 4 | 2004 |
| Decile 3 | 1989 |
| Decile 2 | 1984.5 |
| Decile 1 | 1977.5 |
| Minimum | 1976 |
|
|
- There are 12 distinct values.
- Mean = 1997.73
- Std.dev = 11.6743
- 2 items have value 1988 (1988)
- 2 items have value 1990 (1990)
- 8 items have value 1992 (1992)
- 2 items have value 1995 (1995)
- 4 items have value 1996 (1996)
- 6 items have value 1997 (1997)
- 12 items have value 1998 (1998)
- 8 items have value 1999 (1999)
- 4 items have value 2000 (2000)
- 12 items have value 2001 (2001)
- 10 items have value 2002 (2002)
- 10 items have value 2003 (2003)
|
Notes
blly93 - When was your last period? (Include current period if bleeding now) - year - at age 47 years, blly94 - When was your last period? (Include current period if bleeding now) - year - at age 48 years, blly95 - When was your last period? (Include current period if bleeding now) - year - at age 49 years, blly96 - When was your last period? (Include current period if bleeding now) - year - at age 50 years, blly97 - When was your last period? (Include current period if bleeding now) - year - at age 51 years, blly98 - When was your last period? (Include current period if bleeding now) - year - at age 52 years, blly99 - When was your last period? (Include current period if bleeding now) - year - at age 53 years, blly00 - When was your last period? (Include current period if bleeding now) - year - at age 54 years, blly03 - When was your last period? (Include current period if bleeding now) - year - at age 57 years, blly09 - When was your last period? (Include current period if bleeding now) - year - at age 60-64 years
Coding 20069 defines 16 special values:
- 1975 represents "1975"
- 1988 represents "1988"
- 1990 represents "1990"
- 1991 represents "1991"
- 1992 represents "1992"
- 1993 represents "1993"
- 1994 represents "1994"
- 1995 represents "1995"
- 1996 represents "1996"
- 1997 represents "1997"
- 1998 represents "1998"
- 1999 represents "1999"
- 2000 represents "2000"
- 2001 represents "2001"
- 2002 represents "2002"
- 2003 represents "2003"