Data
3,349 items of data are available, covering 2,191 participants.
Defined-instances run from 26 to 28, labelled using Instancing
1.
Units of measurement are %.
Data has not been summarised because combining instances would be misleading.
2 Instances
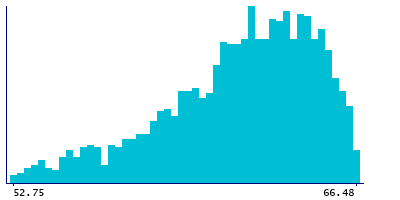
Instance 26 : 2006-2010 - Survey carried out at age 60 to 64 years.
1,621 participants, 1,621 items
| Maximum | 66.48 |
| Decile 9 | 65.265 |
| Decile 8 | 64.5 |
| Decile 7 | 63.745 |
| Decile 6 | 63.07 |
| Median | 62.295 |
| Decile 4 | 61.5 |
| Decile 3 | 60.6 |
| Decile 2 | 59.29 |
| Decile 1 | 57.26 |
| Minimum | 52.75 |
|
|
- Mean = 61.757
- Std.dev = 3.06032
|
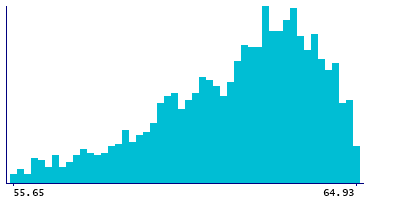
Instance 28 : 2015 - Survey carried out at age 69 years.
1,728 participants, 1,728 items
| Maximum | 64.93 |
| Decile 9 | 64.125 |
| Decile 8 | 63.56 |
| Decile 7 | 63.09 |
| Decile 6 | 62.605 |
| Median | 62.12 |
| Decile 4 | 61.54 |
| Decile 3 | 60.76 |
| Decile 2 | 59.87 |
| Decile 1 | 58.625 |
| Minimum | 55.65 |
|
|
- Mean = 61.6926
- Std.dev = 2.10512
|
Notes
idl_c_p_09 - Total cholesterol to total lipids ratio in IDL (%) - at 60-64 years, idl_c_p_15 - Total cholesterol to total lipids ratio in IDL (%) - at 69 years
0 Related Data-Fields
There are no related data-fields
0 Resources
There are no matching Resources