Data
3,325 items of data are available, covering 2,175 participants.
Defined-instances run from 26 to 28, labelled using Instancing
1.
Units of measurement are %.
Data has not been summarised because combining instances would be misleading.
2 Instances
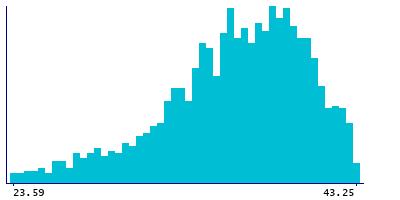
Instance 26 : 2006-2010 - Survey carried out at age 60 to 64 years.
1,620 participants, 1,620 items
| Maximum | 43.25 |
| Decile 9 | 41.02 |
| Decile 8 | 39.86 |
| Decile 7 | 38.86 |
| Decile 6 | 37.88 |
| Median | 36.82 |
| Decile 4 | 35.84 |
| Decile 3 | 34.57 |
| Decile 2 | 33.06 |
| Decile 1 | 30.6 |
| Minimum | 23.59 |
|
|
- Mean = 36.2726
- Std.dev = 4.09722
|
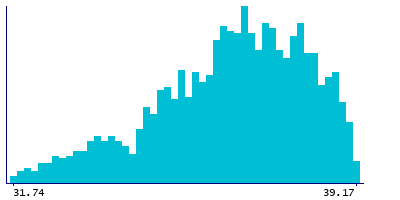
Instance 28 : 2015 - Survey carried out at age 69 years.
1,705 participants, 1,705 items
| Maximum | 39.17 |
| Decile 9 | 38.44 |
| Decile 8 | 37.94 |
| Decile 7 | 37.48 |
| Decile 6 | 37.06 |
| Median | 36.655 |
| Decile 4 | 36.23 |
| Decile 3 | 35.695 |
| Decile 2 | 35.04 |
| Decile 1 | 33.965 |
| Minimum | 31.74 |
|
|
- Mean = 36.4291
- Std.dev = 1.64761
|
Notes
l_hdl_ce_p_09 - Cholesterol esters to total lipids ratio in large HDL (%) - at 60-64 years, l_hdl_ce_p_15 - Cholesterol esters to total lipids ratio in large HDL (%) - at 69 years
0 Related Data-Fields
There are no related data-fields
0 Resources
There are no matching Resources