Data
3,353 items of data are available, covering 2,188 participants.
Defined-instances run from 26 to 28, labelled using Instancing
1.
Units of measurement are %.
Data has not been summarised because combining instances would be misleading.
2 Instances
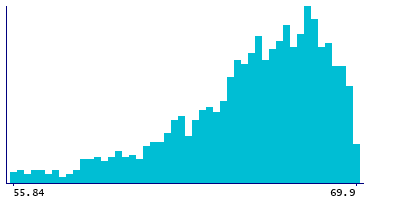
Instance 26 : 2006-2010 - Survey carried out at age 60 to 64 years.
1,622 participants, 1,622 items
| Maximum | 69.9 |
| Decile 9 | 68.945 |
| Decile 8 | 68.2 |
| Decile 7 | 67.61 |
| Decile 6 | 66.935 |
| Median | 66.19 |
| Decile 4 | 65.45 |
| Decile 3 | 64.59 |
| Decile 2 | 63.235 |
| Decile 1 | 61.235 |
| Minimum | 55.84 |
|
|
- Mean = 65.58
- Std.dev = 3.04513
|
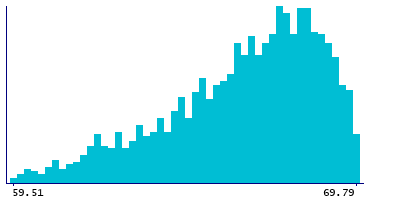
Instance 28 : 2015 - Survey carried out at age 69 years.
1,731 participants, 1,731 items
| Maximum | 69.79 |
| Decile 9 | 68.975 |
| Decile 8 | 68.43 |
| Decile 7 | 67.94 |
| Decile 6 | 67.44 |
| Median | 66.83 |
| Decile 4 | 66.245 |
| Decile 3 | 65.45 |
| Decile 2 | 64.465 |
| Decile 1 | 62.945 |
| Minimum | 59.51 |
|
|
- Mean = 66.3865
- Std.dev = 2.29074
|
Notes
l_ldl_c_p_09 - Total cholesterol to total lipids ratio in large LDL (%) - at 60-64 years, l_ldl_c_p_15 - Total cholesterol to total lipids ratio in large LDL (%) - at 69 years
0 Related Data-Fields
There are no related data-fields
0 Resources
There are no matching Resources