Data
3,350 items of data are available, covering 2,197 participants.
Defined-instances run from 26 to 28, labelled using Instancing
1.
Units of measurement are %.
Data has not been summarised because combining instances would be misleading.
2 Instances
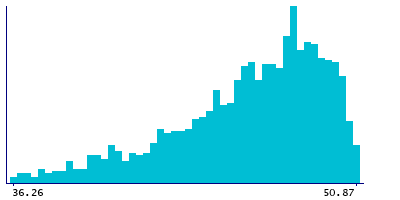
Instance 26 : 2006-2010 - Survey carried out at age 60 to 64 years.
1,621 participants, 1,621 items
| Maximum | 50.87 |
| Decile 9 | 49.825 |
| Decile 8 | 49.06 |
| Decile 7 | 48.35 |
| Decile 6 | 47.76 |
| Median | 46.925 |
| Decile 4 | 46.065 |
| Decile 3 | 44.995 |
| Decile 2 | 43.615 |
| Decile 1 | 41.415 |
| Minimum | 36.26 |
|
|
- Mean = 46.2335
- Std.dev = 3.21843
|
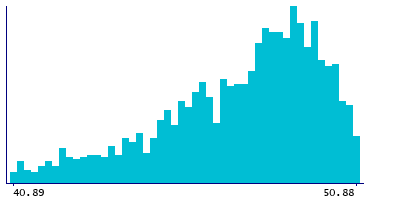
Instance 28 : 2015 - Survey carried out at age 69 years.
1,729 participants, 1,729 items
| Maximum | 50.88 |
| Decile 9 | 50.1 |
| Decile 8 | 49.55 |
| Decile 7 | 49.045 |
| Decile 6 | 48.53 |
| Median | 48.05 |
| Decile 4 | 47.345 |
| Decile 3 | 46.46 |
| Decile 2 | 45.56 |
| Decile 1 | 44.06 |
| Minimum | 40.89 |
|
|
- Mean = 47.4867
- Std.dev = 2.30824
|
Notes
l_ldl_ce_p_09 - Cholesterol esters to total lipids ratio in large LDL (%) - at 60-64 years, l_ldl_ce_p_15 - Cholesterol esters to total lipids ratio in large LDL (%) - at 69 years
0 Related Data-Fields
There are no related data-fields
0 Resources
There are no matching Resources