Data
3,316 items of data are available, covering 2,167 participants.
Defined-instances run from 26 to 28, labelled using Instancing
1.
Units of measurement are %.
Data has not been summarised because combining instances would be misleading.
2 Instances
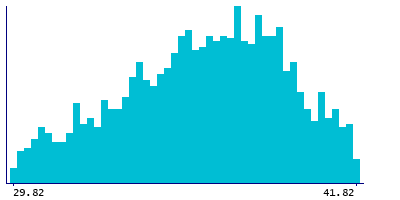
Instance 26 : 2006-2010 - Survey carried out at age 60 to 64 years.
1,618 participants, 1,618 items
| Maximum | 41.82 |
| Decile 9 | 40.08 |
| Decile 8 | 39.04 |
| Decile 7 | 38.295 |
| Decile 6 | 37.53 |
| Median | 36.73 |
| Decile 4 | 35.875 |
| Decile 3 | 35 |
| Decile 2 | 33.895 |
| Decile 1 | 32.28 |
| Minimum | 29.82 |
|
|
- Mean = 36.4606
- Std.dev = 2.85365
|
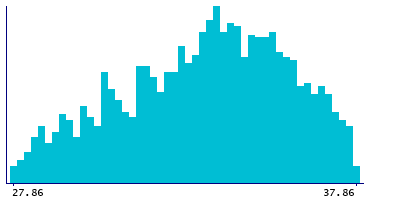
Instance 28 : 2015 - Survey carried out at age 69 years.
1,698 participants, 1,698 items
| Maximum | 37.86 |
| Decile 9 | 36.55 |
| Decile 8 | 35.65 |
| Decile 7 | 34.96 |
| Decile 6 | 34.29 |
| Median | 33.67 |
| Decile 4 | 33 |
| Decile 3 | 32.145 |
| Decile 2 | 31.135 |
| Decile 1 | 29.92 |
| Minimum | 27.86 |
|
|
- Mean = 33.4267
- Std.dev = 2.41017
|
Notes
pufafa_09 - Ratio of polyunsaturated fatty acids to total fatty acids (%) - at 60-64 years, pufafa_15 - Ratio of polyunsaturated fatty acids to total fatty acids (%) - at 69 years
0 Related Data-Fields
There are no related data-fields
0 Resources
There are no matching Resources