Data
3,342 items of data are available, covering 2,174 participants.
Defined-instances run from 26 to 28, labelled using Instancing
1.
Units of measurement are %.
Data has not been summarised because combining instances would be misleading.
2 Instances
Instance 26 : 2006-2010 - Survey carried out at age 60 to 64 years.
1,621 participants, 1,621 items
| Maximum | 68.14 |
| Decile 9 | 66.595 |
| Decile 8 | 65.505 |
| Decile 7 | 64.65 |
| Decile 6 | 63.75 |
| Median | 62.655 |
| Decile 4 | 61.53 |
| Decile 3 | 60.085 |
| Decile 2 | 58.145 |
| Decile 1 | 55.235 |
| Minimum | 48.53 |
|

|
- Mean = 61.7301
- Std.dev = 4.38425
|
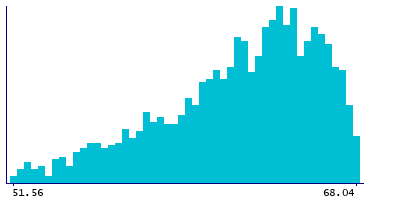
Instance 28 : 2015 - Survey carried out at age 69 years.
1,721 participants, 1,721 items
| Maximum | 68.04 |
| Decile 9 | 66.7 |
| Decile 8 | 65.82 |
| Decile 7 | 64.9 |
| Decile 6 | 64.06 |
| Median | 63.14 |
| Decile 4 | 62.12 |
| Decile 3 | 60.88 |
| Decile 2 | 59.125 |
| Decile 1 | 56.81 |
| Minimum | 51.56 |
|
|
- Mean = 62.3967
- Std.dev = 3.75291
|
Notes
s_ldl_c_p_09 - Total cholesterol to total lipids ratio in small LDL (%) - at 60-64 years, s_ldl_c_p_15 - Total cholesterol to total lipids ratio in small LDL (%) - at 69 years
0 Related Data-Fields
There are no related data-fields
0 Resources
There are no matching Resources