Data
3,349 items of data are available, covering 2,181 participants.
Defined-instances run from 26 to 28, labelled using Instancing
1.
Units of measurement are %.
Data has not been summarised because combining instances would be misleading.
2 Instances
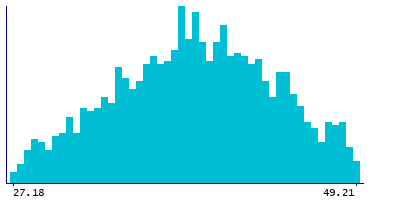
Instance 26 : 2006-2010 - Survey carried out at age 60 to 64 years.
1,619 participants, 1,619 items
| Maximum | 49.21 |
| Decile 9 | 45.5 |
| Decile 8 | 43.465 |
| Decile 7 | 41.8 |
| Decile 6 | 40.375 |
| Median | 38.9 |
| Decile 4 | 37.645 |
| Decile 3 | 36.03 |
| Decile 2 | 34.11 |
| Decile 1 | 31.745 |
| Minimum | 27.18 |
|
|
- Mean = 38.7954
- Std.dev = 5.08646
|
Instance 28 : 2015 - Survey carried out at age 69 years.
1,730 participants, 1,730 items
| Maximum | 47.63 |
| Decile 9 | 44.62 |
| Decile 8 | 42.54 |
| Decile 7 | 41.04 |
| Decile 6 | 39.56 |
| Median | 38.35 |
| Decile 4 | 37.11 |
| Decile 3 | 35.76 |
| Decile 2 | 34.28 |
| Decile 1 | 32.69 |
| Minimum | 29.65 |
|

|
- Mean = 38.4377
- Std.dev = 4.38391
|
Notes
s_vldl_tg_p_09 - Triglycerides to total lipids ratio in small VLDL (%) - at 60-64 years, s_vldl_tg_p_15 - Triglycerides to total lipids ratio in small VLDL (%) - at 69 years
0 Related Data-Fields
There are no related data-fields
0 Resources
There are no matching Resources