Data
836 items of data are available, covering 485 participants.
Defined-instances run from 60 to 61, labelled using Instancing
1.
Units of measurement are Not applicable.
Data has not been summarised because combining instances would be misleading.
2 Instances
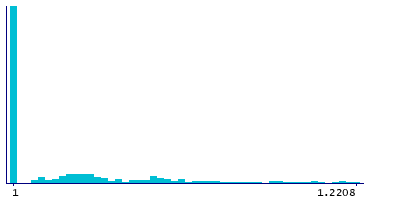
Instance 60 : 2015-2018 - Insight46 Phase 1
440 participants, 440 items
| Maximum | 1.2208 |
| Decile 9 | 1.1233 |
| Decile 8 | 1.0789 |
| Decile 7 | 1.0462 |
| Decile 6 | 1.029 |
| Median | 1 |
| Decile 4 | 1 |
| Decile 3 | 1 |
| Decile 2 | 1 |
| Decile 1 | 1 |
| Minimum | 1 |
|
|
- Mean = 1.03723
- Std.dev = 0.0551285
|
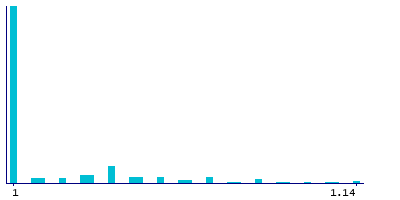
Instance 61 : 2018-2021 - Insight46 Phase 2
396 participants, 396 items
| Maximum | 1.15 |
| Decile 9 | 1.07 |
| Decile 8 | 1.04 |
| Decile 7 | 1.025 |
| Decile 6 | 1 |
| Median | 1 |
| Decile 4 | 1 |
| Decile 3 | 1 |
| Decile 2 | 1 |
| Decile 1 | 1 |
| Minimum | 1 |
|
|
- Mean = 1.01932
- Std.dev = 0.0334436
- 3 items above graph maximum of 1.14
|
Notes
bt_ds_rgt15_i46p1 - Dysmetria score (DS) - Weighted index of number of incorrect key taps, scored in a target fashion, then divided by the total number of key taps - right hand- Insight46 phase 1, bt_ds_rgt15_i46p2 - Dysmetria score (DS) - Weighted index of number of incorrect key taps, scored in a target fashion, then divided by the total number of key taps - right hand- Insight46 phase 2
0 Related Data-Fields
There are no related data-fields
0 Resources
There are no matching Resources