Data
838 items of data are available, covering 476 participants.
Defined-instances run from 60 to 61, labelled using Instancing
1.
Units of measurement are %.
Data has not been summarised because combining instances would be misleading.
2 Instances
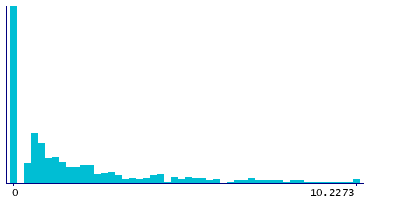
Instance 60 : 2015-2018 - Insight46 Phase 1
458 participants, 458 items
| Maximum | 10.2273 |
| Decile 9 | 5.31818 |
| Decile 8 | 3.06122 |
| Decile 7 | 2.10526 |
| Decile 6 | 1.41851 |
| Median | 0.943396 |
| Decile 4 | 0.664459 |
| Decile 3 | 0 |
| Decile 2 | 0 |
| Decile 1 | 0 |
| Minimum | 0 |
|
|
- Mean = 1.84156
- Std.dev = 2.32405
|
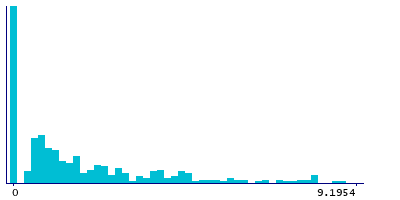
Instance 61 : 2018-2021 - Insight46 Phase 2
380 participants, 380 items
| Maximum | 9.30233 |
| Decile 9 | 4.5977 |
| Decile 8 | 3.27869 |
| Decile 7 | 2.22222 |
| Decile 6 | 1.5544 |
| Median | 1.05263 |
| Decile 4 | 0.724638 |
| Decile 3 | 0.507614 |
| Decile 2 | 0 |
| Decile 1 | 0 |
| Minimum | 0 |
|
|
- Mean = 1.77716
- Std.dev = 2.05284
- 1 item above graph maximum of 9.1954
|
Notes
circle_erro_i46p1 - Circle tracing: percentage of incorrect subtraction responses summed across all 6 trials combined - Insight46 phase 1, cerro_i46p2 - Circle tracing: percentage of incorrect subtraction responses summed across all 6 trials combined - Insight46 phase 2
0 Related Data-Fields
There are no related data-fields
0 Resources
There are no matching Resources