Data
10,023 items of data are available, covering 10,023 participants.
Defined-instances run from 1 to 1, labelled using Instancing
1.
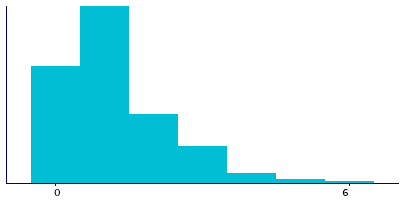
Units of measurement are days.
| Maximum | 7 |
| Decile 9 | 3 |
| Decile 8 | 2 |
| Decile 7 | 2 |
| Decile 6 | 1 |
| Median | 1 |
| Decile 4 | 1 |
| Decile 3 | 1 |
| Decile 2 | 0 |
| Decile 1 | 0 |
| Minimum | 0 |
|
|
- There are 8 distinct values.
- Mean = 1.38711
- Std.dev = 1.50233
- 312 items above graph maximum of 6
|
Notes
Number of days per week that fried foods are consumed (e.g. fried beans, quesadillas)
0 Related Data-Fields
There are no related data-fields
0 Resources
There are no matching Resources
